


With the year coming to a close and code freezes settling in, we’re taking a brief pause to look back on a pivotal few months for our team and to preview what’s in store for you. As we enter 2026, our focus is clear: delivering the most advanced mobile observability workflows so mobile teams can build boldly and ship with confidence.
By now, you’ve likely seen the news: We’ve rebranded from Instabug to Luciq.
But while the holidays are usually a time for things to slow down, work on our platform has only accelerated. We are entering the new year with a renewed obsession: helping mobile teams build something that matters. We believe mobile observability shouldn’t just watch your app or stop at basic mobile app performance monitoring; it should work for it.
We wanted to get these features into your hands now, so when you return in January, you have the enterprise-ready, mobile-first intelligence you need to hit the ground running.
Here is what we unwrapped in December to help you ship confidently.
December Drop Highlights: What’s New in Luciq’s Agentic Mobile Observability Platform
We spent this month focusing on "heavy lifting": eliminating the manual, reactive grunt work that plagues mobile engineering. These updates strengthen every layer of your observability workflow, from setup to resolution, going far beyond what traditional mobile performance monitoring, mobile debugging tools, crash reporting platforms, or log-based monitoring systems can offer; we didn't just add features, we optimized your entire workflow from the first line of code to the final user interaction.
Here is how Luciq is changing the game right now - consider this your ‘December Drop TL;DRD’ before we unpack each update:
Faster Setup with Agentic Instrumentation: Zero to Agentic Mobile Observability in Minutes
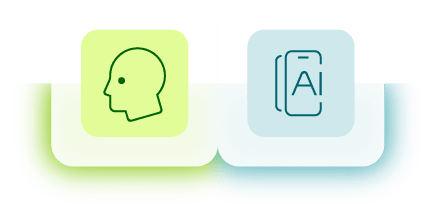
Manual setup is the bottleneck before you even begin. Developers often need days of 'spelunking' through code to guess where configurations belong. We’ve replaced the documentation copy-paste grind with Agentic Instrumentation. Now, you simply point your coding agent (like Cursor, Claude Code, or Codex) at our integration guide to trigger a simple and guided workflow. The agent handles the tedious parts like fetching the latest SDK, wiring up triggers, and configuring privacy masking while you verify each step. It’s not just faster; it eliminates 'invisible misconfigurations,' ensuring you go from zero to a fully validated, enterprise-ready app in a single conversation. Agentic Instrumentation ensures your app is fully prepared for accurate agentic mobile observability, from performance insights used in mobile app performance monitoring to the deeper context your teams rely on.
Kill Slow and Frozen Frames with Screen Rendering
A stable app isn't just about avoiding crashes; it is about responsiveness. Users lose patience when screens freeze or lag, yet developers often lack the data to pinpoint exactly why it is happening. Screen Rendering fills this blind spot in your Observability Workflow, replacing guesswork with precision. We now provide deep visibility into Frozen and Slow frames, allowing you to identify exactly which screens are performing poorly and frustrating users.
Slash Resolution Time and Debug Directly in Your IDE with Luciq’s MCP Server
As part of our Intelligence Workflow, we believe in slashing resolution time by bringing the data to you. Context switching is a tax on your focus: every time you Alt-Tab, you lose your flow. With our new Model Context Protocol (MCP) Server (currently in beta) we’re fast-tracking your resolution time by bridging the gap between your data and your code. Instead of "dashboard archaeology," simply tell your editor to "Show critical bugs on iOS 17" - and instantly pull the relevant stack traces, user actions, and deep context right into your IDE. It’s the fastest way to slash MTTR: keep your system of record in the dashboard, but put your engine for velocity where you actually work.
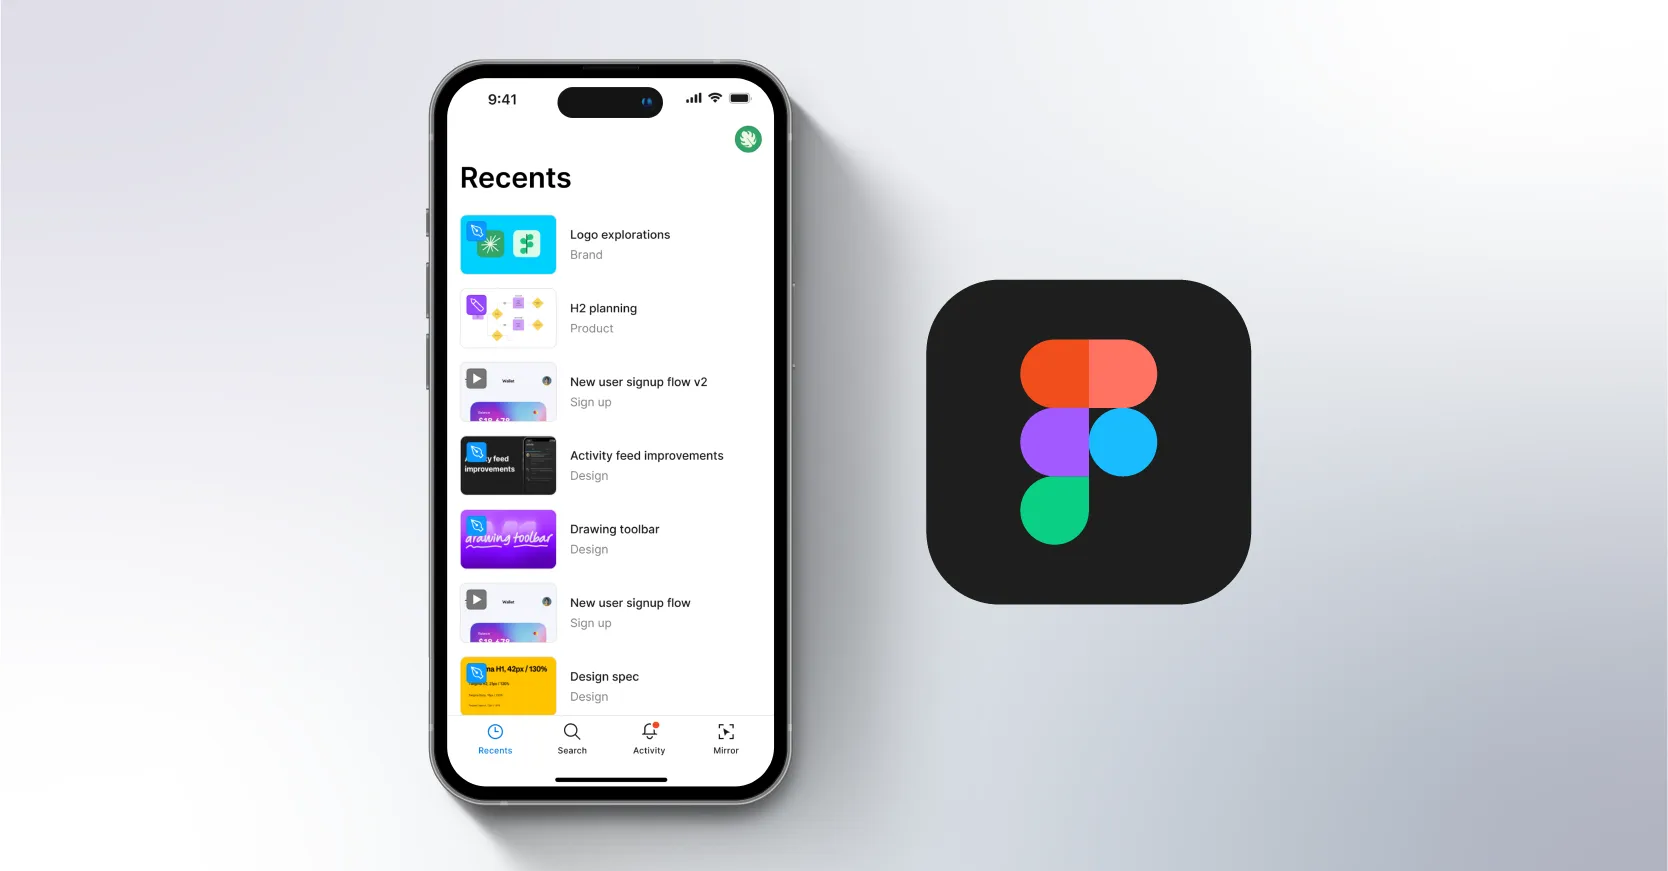
Session Replay 2.0: Deep User Insights for Enhanced Mobile Observability
Logs tell you what broke, but they rarely explain why a user got frustrated. Session Replay 2.0 bridges that gap, and completes your mobile observability workflow, by moving you from an overwhelming search for signals to pinpointing issues at a glance. We have completely revamped the navigation and UX, starting with a reimagined sessions list that makes finding the right user session effortless. Once you dive in, you’ll find a video-like experience that captures every end-user step, backed by a deeply enhanced logging interface.
We’ve replaced the hassle of disjointed debugging with a unified timeline that uses synchronized color codes to instantly link logs, screenshots, and session data. It is the "see everything" layer of your stack: with new advanced filters across both the list view and session details, you can correlate UI actions with network events chronologically. You don’t just see code failures; you see the exact human journey that led to them. It’s the visual evidence you need to reproduce complex bugs in minutes instead of hours.
AI Crash Insights: Faster Diagnosis with Intelligent Mobile Debugging
Debugging shouldn't be a game of "spot the difference" across hundreds of crash logs. We’ve launched Crash Insights as an exciting new capability of our new Resolve Agent within our Resolution workflow.
Instead of manually hunting for correlations, like a specific OS version or feature flag triggering an OOM, our agent instantly analyzes all occurrences to surface the hidden patterns causing the issue. It turns hours of manual guesswork into immediate clarity. As part of this workflow, Crash Insights enhances the capabilities teams typically expect from mobile debugging tools by automatically surfacing patterns across crashes, ANRs, and performance issues. This is just the foundation. With the Resolve Agent already identifying reproduction steps and generating code fixes, we are now evolving these capabilities toward a fully automated resolution workflow in the new year.

Enterprise Readiness: Scalable Mobile Observability for Large Teams
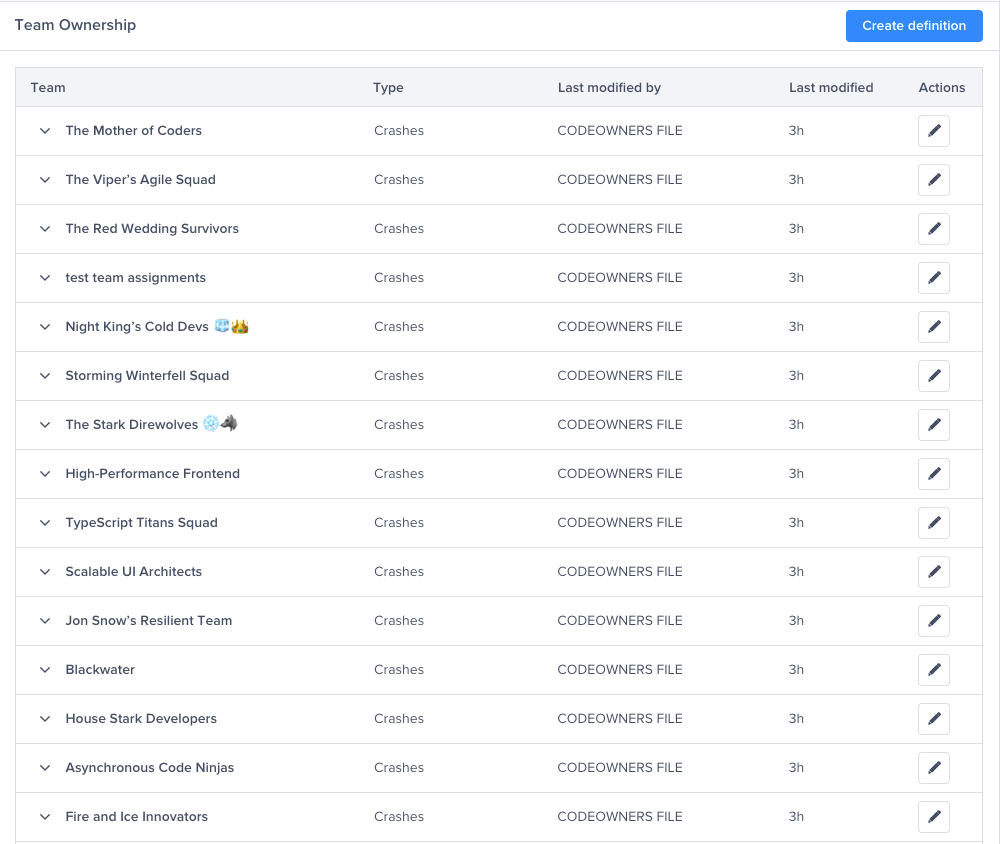
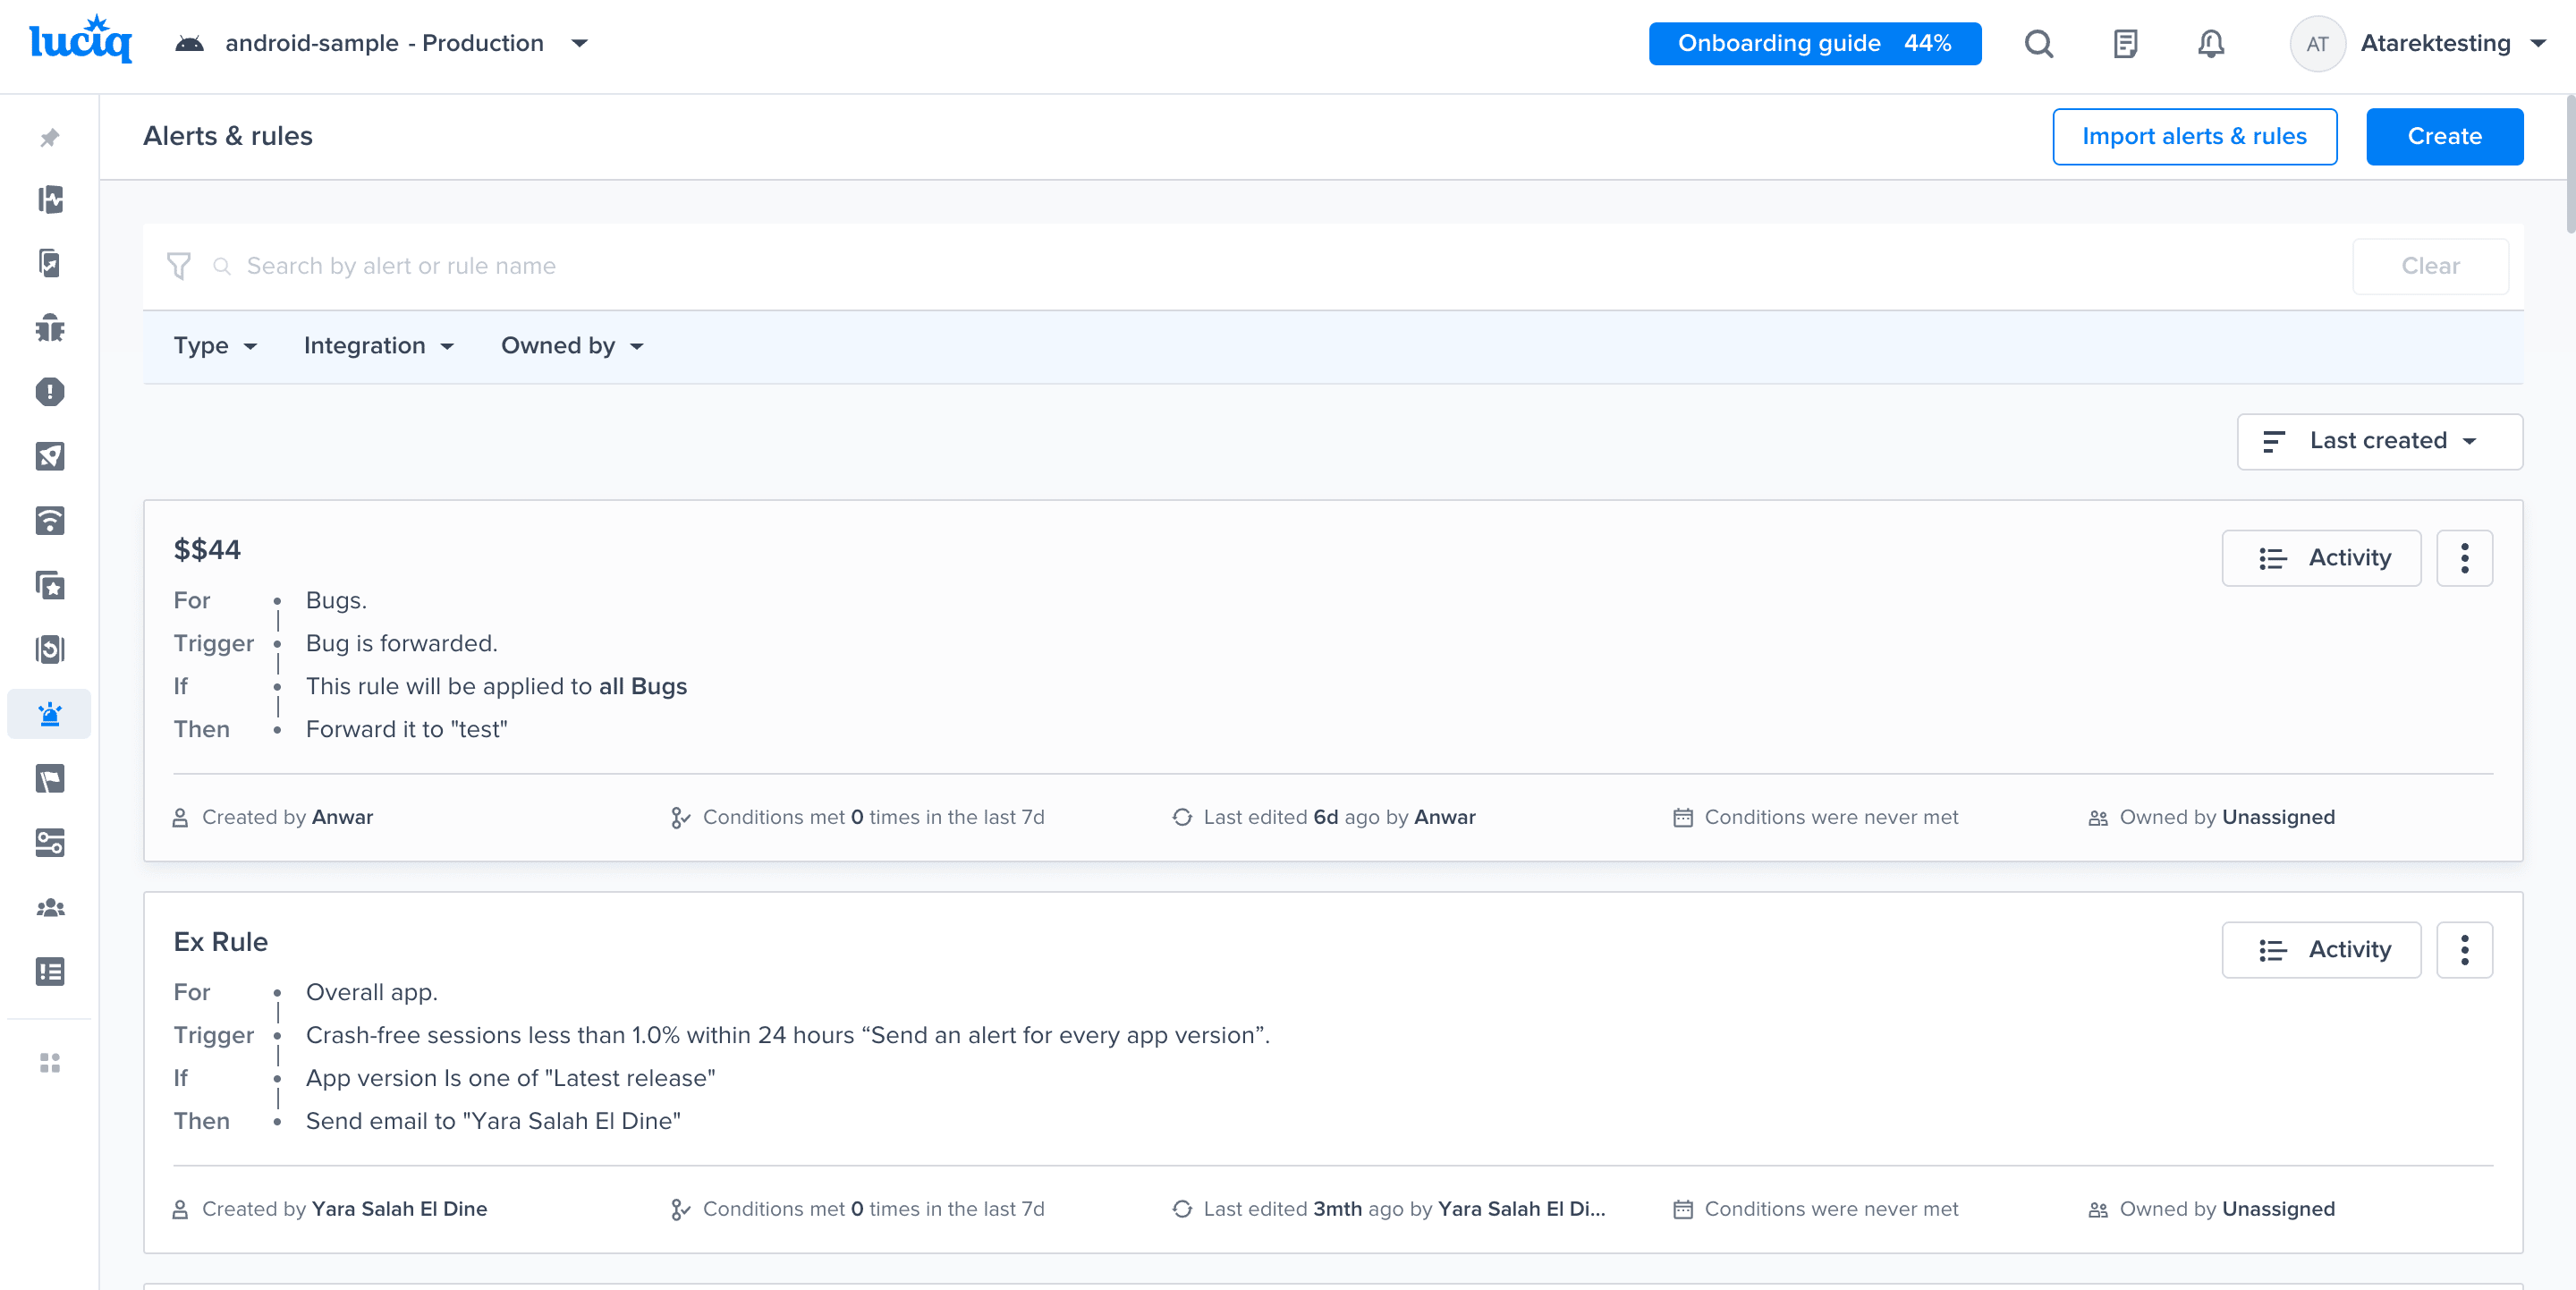
For teams managing complexity, "working" isn't enough, it has to scale. We are deeply committed to being Enterprise-First, ensuring your tooling grows as fast as you do. This month, we introduced One Code Apps, allowing you to manage multiple apps (like white-label versions) from a single codebase: install once, and we handle the rest. We also streamlined your operations: you can now Copy Alerts & Rules to keep applications perfectly in sync with one click, and with GitHub Team Ownership, we automatically route crash reports to the right team based on your repository's existing logic. No manual assignment required, just accurate routing from day one.
This is just the baseline. We are dedicated to shipping enhancements that supercharge large engineering organizations, ensuring your observability infrastructure grows as fast as you do.
Looking Ahead: Stable Code. Happy Users.
This December drop is just the beginning.
As we head into the new year, we are doubling down on the two things that matter most to mobile teams: Developer Productivity and Mobile Customer Experience.
We are committed to building a platform that doesn’t make you choose between shipping fast and shipping quality.
We have plenty more in store for January that will continue this evolution. Stay tuned.
For now, enjoy the break, happy holidays, and get ready. We’re just getting started.