












For you, your scripts, and the agents you already run.
The Luciq CLI puts your mobile observability data one command from your terminal. It runs the same mobile MCP observability tools our MCP server for mobile exposes to agents, returning clean JSON that scripts, CI jobs, and agents can read without ever opening a dashboard.

Your app's crash and performance data has always lived in one place: a dashboard. That's perfect when you're sitting in front of it. It's useless when the thing that needs the data is a release script, a CI job, or the coding agent open in your editor. So we closed that gap. The Luciq CLI now brings your data, and the actions you take on it, to your terminal, your pipelines, and your agents. One install:
gem install luciq-cli
And your top crashes are a command away:
luciq crashes list --slug my-app --mode production --limit 3
{
  "crashes": [
    {
      "number": 43,
      "exception": "Crash due to signal: SIGABRT(#0) …",
      "crash_type": "CRASH",
      "occurrences_counter": 1145,
      "affected_users_counter": 1147,
      "max_app_version": "3.0.4 (3)"
    }
  ]
}
Out of the dashboard, into your workflow.
Read Your Mobile Observability Data rom Anywhere
Crashes, bugs, performance, reviews, surveys, they're all a command away, and every command returns clean, agent-ready JSON. So it pipes straight into whatever you already use:
luciq crashes list --slug my-app --mode production --limit 3 \
  | jq '.crashes[] | {number, exception, users: .affected_users_counter}'

Every command returns JSON, ready to pipe into jq, a script, or your own tooling. One command worth calling out: luciq issues list ranks your biggest problems across crashes, performance, AI-detected issues, and bugs in a single call, the same prioritized view you'd scan in the dashboard, now something a script can read every morning.
Don't Just Look. Act.
The CLI writes back, too, so you can stand up monitoring and respond to it without ever leaving the terminal. Run luciq alerts init to see every trigger, condition, and connected integration you can use, then create the rule. Here's one that forwards a crash spike on the checkout screen straight to Slack:
luciq alerts init --slug my-app --mode production   # discover triggers, conditions & your integrations

luciq alerts create --slug my-app --mode production --payload '{
  "type": "Crashes",
  "title": "Crash spike on checkout",
  "trigger": "occurrences_count_in_time",
  "trigger_options": { "time": "Within 1 hour", "values": [{ "key": "occurrences_count", "value": 100 }] },
  "conditions": [{ "key": "current_view", "operator": "Contains", "value": "Checkout" }],
  "actions": [{ "key": "forward", "value": "Slack · #mobile-alerts", "frequency": "Once an hour" }]
}'

# When it fires, resolve the incident right from your shell
luciq incidents resolve --slug my-app --mode production --ulid 01J8...
Built for your release pipeline. Symbol uploads cover every mobile platform, iOS, Android, React Native, and Flutter, across dSYMs, mapping files, NDK symbols, and source maps:
luciq upload ios-dsym MyApp-dSYMs.zip --app-token "$LUCIQ_APP_TOKEN"
Two things make this pipeline-native. Uploads authenticate with your app token, the same one your SDK already uses, so a CI job pushes symbols without ever logging in. And a failed upload exits non-zero, so your build fails loudly instead of quietly shipping crashes nobody can read. (The upload ✓ is shown in the demo above.)
The Same Mobile MCP Observability Tools Your agents Use, Now in Your Shell
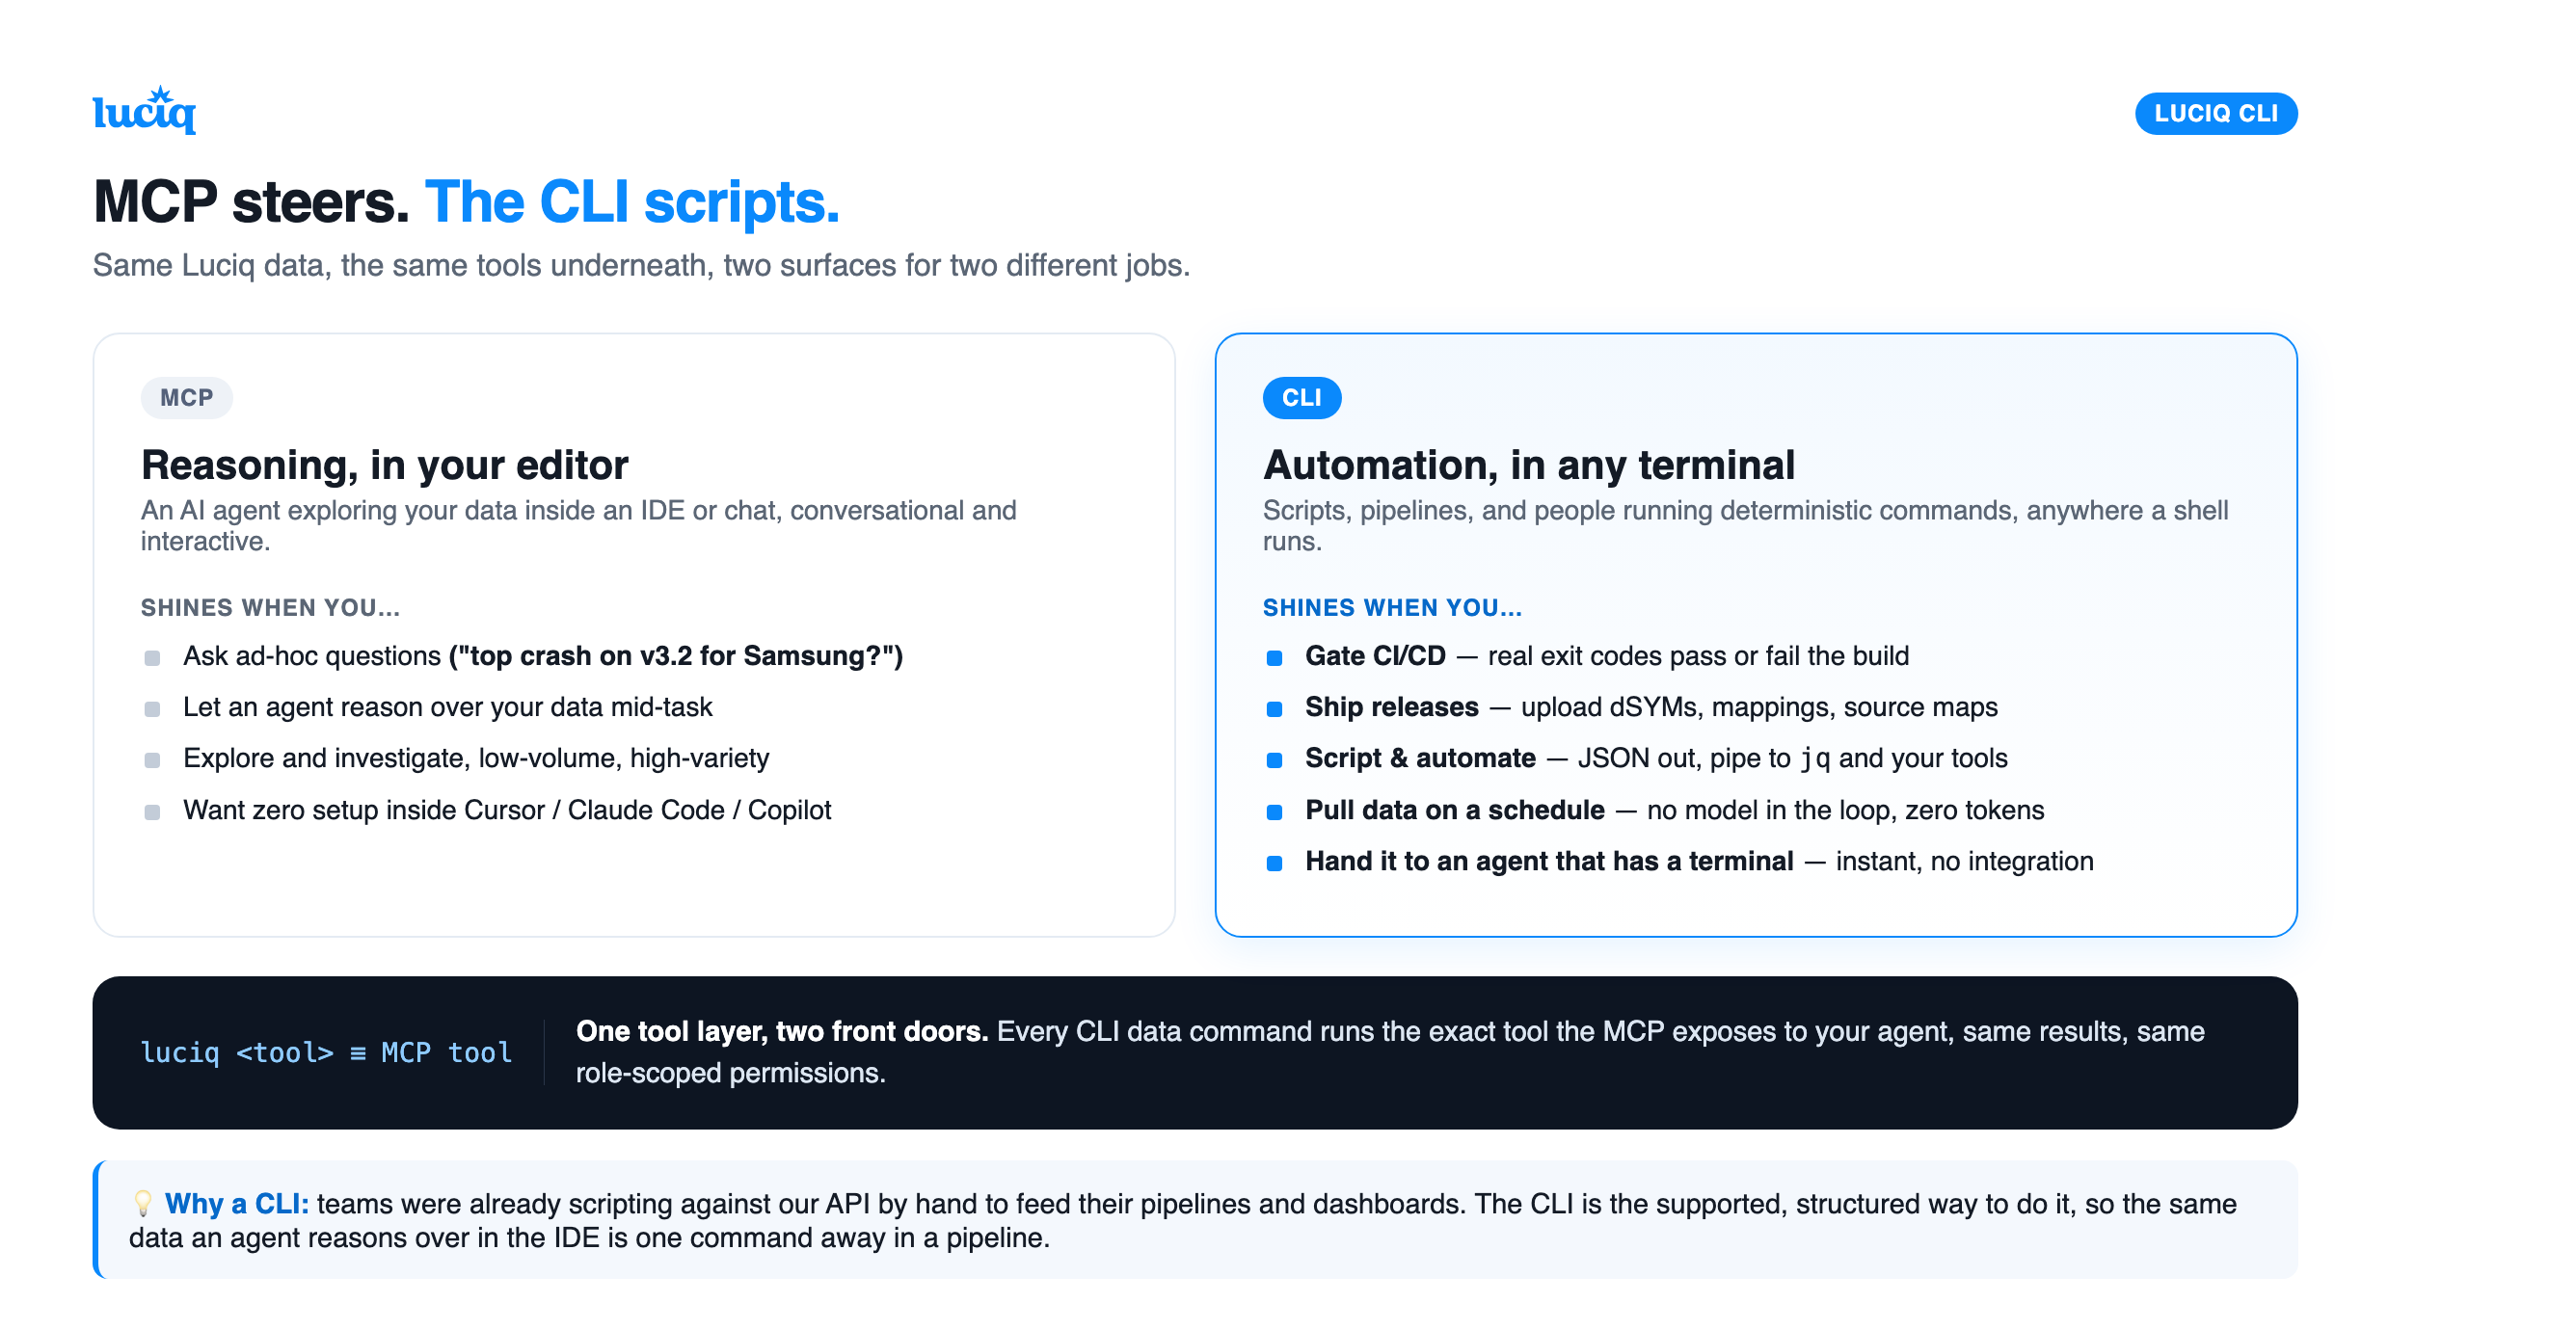
If you've used the Luciq MCP server for mobile, this will feel familiar, because it's the same thing underneath. Every data command runs the exact tool our MCP exposes to your AI assistant, through the same permissions and the same results.
The simplest way to think about it: MCP is for conversation, the CLI is for automation. The MCP shines when the question is fuzzy, "why did crashes spike after the release?", with an agent reasoning over your data in the editor. The CLI shines when the work is precise and repeatable, and when there's no human, and no model, in the loop at all: a CI gate, a cron job, a release pipeline that just needs the same JSON back every time. When you already know what you want, "the top 10 crashes this week", one command is faster and more reliable than asking an agent, and it moves bulk data without burning a token, hand a slice to an agent afterward if you want the reasoning.
Anything on a schedule or in a pipeline → the CLI. Anything exploratory → the MCP and an agent. Mature teams use both, and since they share the same tools underneath, it's one story with two surfaces. Several teams were already scripting against our API by hand to do exactly this; the CLI just turns that into a supported, first-class workflow.
How Access Works
Your CLI runs with a personal token, tied to your account and scoped to your permissions, so it can only ever see and do what you can. One token per person, revocable anytime from your dashboard. Uploads are the exception by design: they use your app token so CI never touches personal credentials. Data commands are rate-limited and return clean errors your scripts can handle.
Get started
It's live!
gem install luciq-cli
# or: brew install luciqai/tap/luciq-cli
luciq login
luciq apps list
The full command reference and CI examples are in the docs. This is the first release of the read-and-write surface, and we're just getting started, so tell us what you'd want to run next.