







Mobile crash reporting that goes all the way to root cause.
Crashes, ANRs, OOMs, hangs, and performance, fully debuggable, with stack traces, repro steps, full logs, and session replay. Plus the visual issues and broken flows our AI detects automatically, before QA or your users ever report them. All out of the box.
Crashes & performance
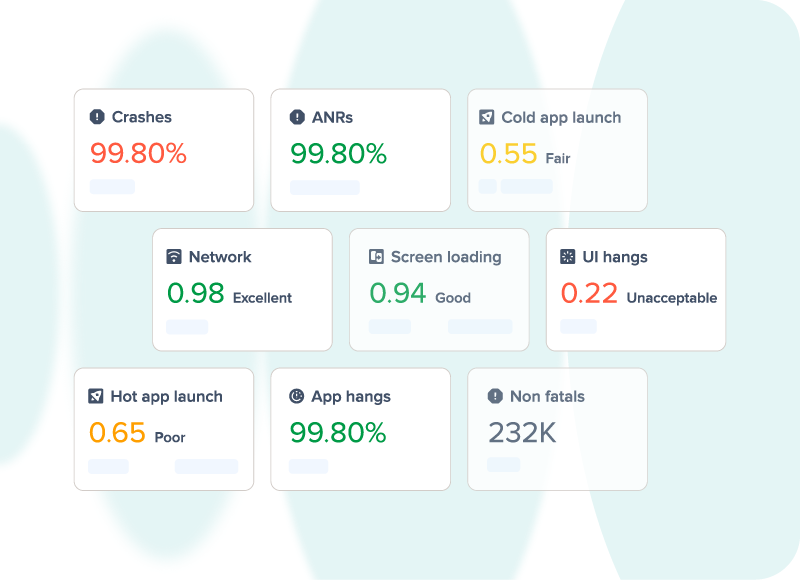
Crashes, OOMs, ANRs, and hangs, plus every performance bottleneck, fully debuggable, with stack traces and repro steps.

AI-detected visual issues
Frozen frames, layout glitches, and broken UI, caught automatically by AI, the moment they happen. No waiting for a QA pass or a user complaint.

Works out of the box
Every signal is on the moment you drop in the SDK, no instrumentation, no test scripts, no config. Detection included.
From crash to root cause, explored.
Crashes, ANRs, OOMs & hangs
Every stability error, fully debuggable
Capture all the quality metrics that matter, crashes, out-of-memory terminations, ANRs, and app hangs, with everything you need to debug them: the full stack trace, the exact failing line, the versions, screens, and feature flags affected, and the steps to reproduce.
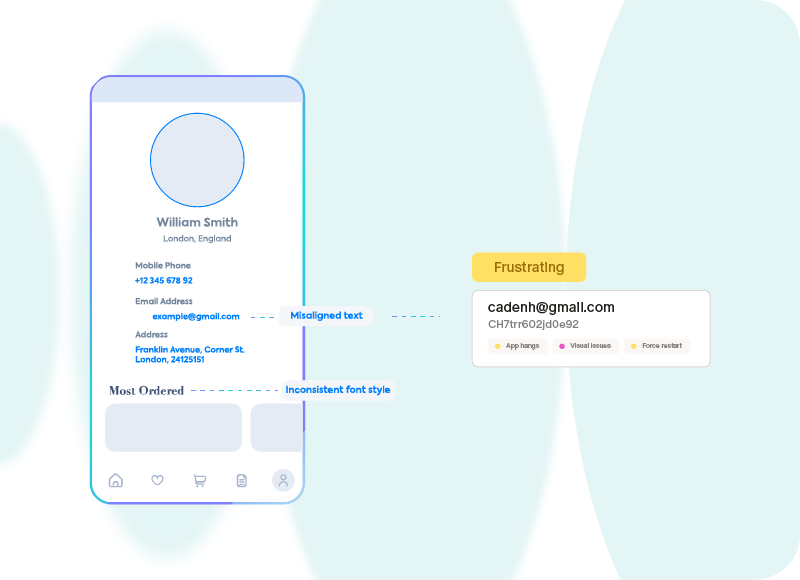
AI detection · Detect Agent
Catch the issues no one reported, automatically
Some of the worst bugs never throw an exception: a frozen frame, a silent button, a checkout flow that quietly breaks. Luciq's Detect Agent uses computer vision to catch these automatically, the moment they happen, no waiting for a QA pass or a one-star review. On out of the box, no instrumentation.
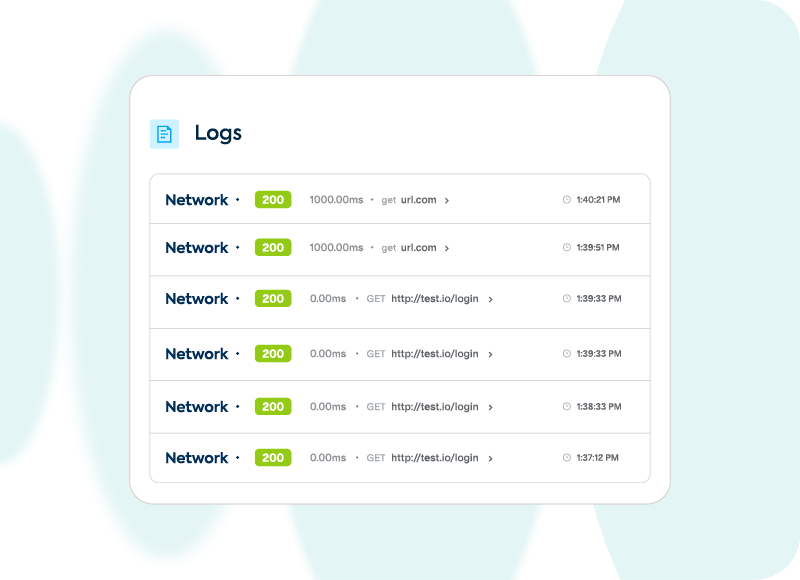
Drill into any occurrence
Replay the exact moment it broke
Go from the aggregate pattern down to a single occurrence and see everything around it: console logs, network requests with payloads, headers and responses, file I/O, database queries, the exact user steps, and a session-replay video of what the user was doing when it broke.
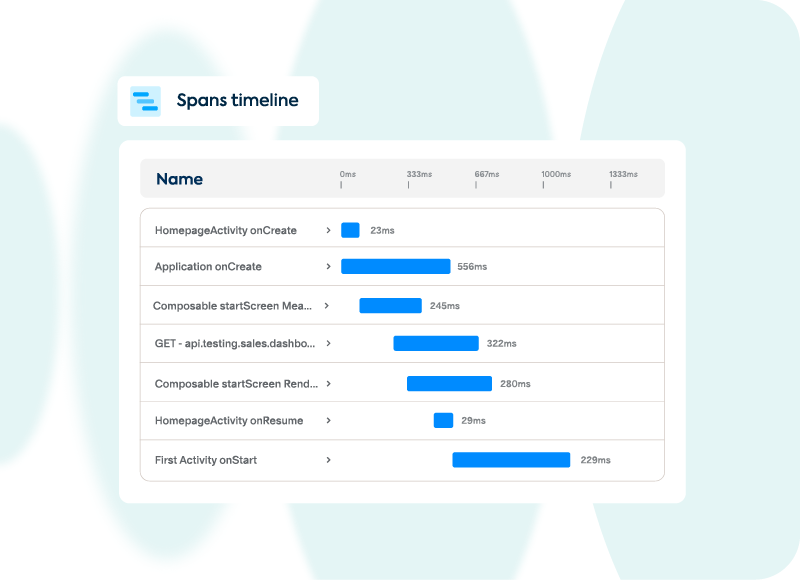
Performance
Find the root cause, not just the symptom
Debug every performance issue down to the span and function, see exactly how long each one takes to load. Track app launch time, network delays, frozen frames, screen loading, and more, so you fix the cause instead of guessing at the symptom.
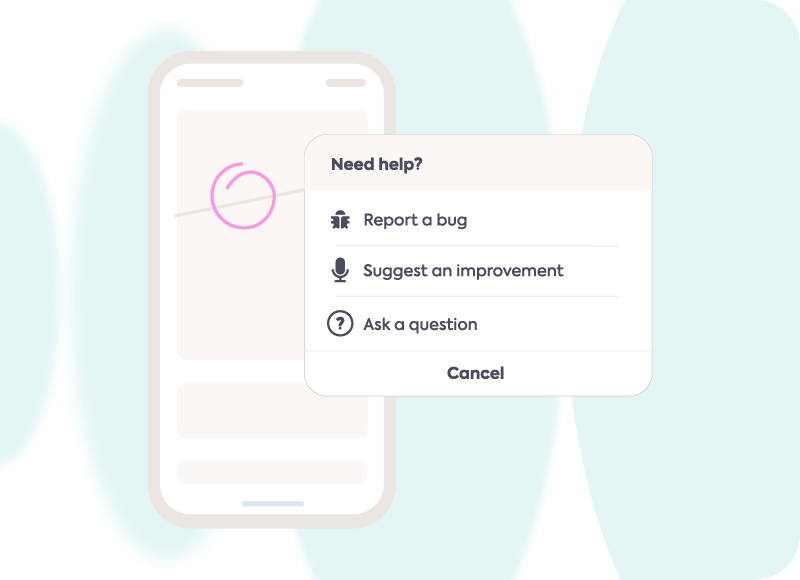
Bug reporting
Turn every user into your best QA team
Let your users, beta testers, and internal teams report issues as if they were a world-class QA team. Every bug report lands with the full technical context behind it, logs, network calls, steps, and session, so there's nothing left to chase down.
Capturing the issue is just the start.
Every signal on this page flows straight into the workflow, from diagnosis, to an automated fix, to the agent you already use.
Fix in minutes with Companion
For every signal we capture, the Companion takes you to the fix in minutes instead of days, root cause and repro in plain language.
Meet the Companion
Turn on Autopilot
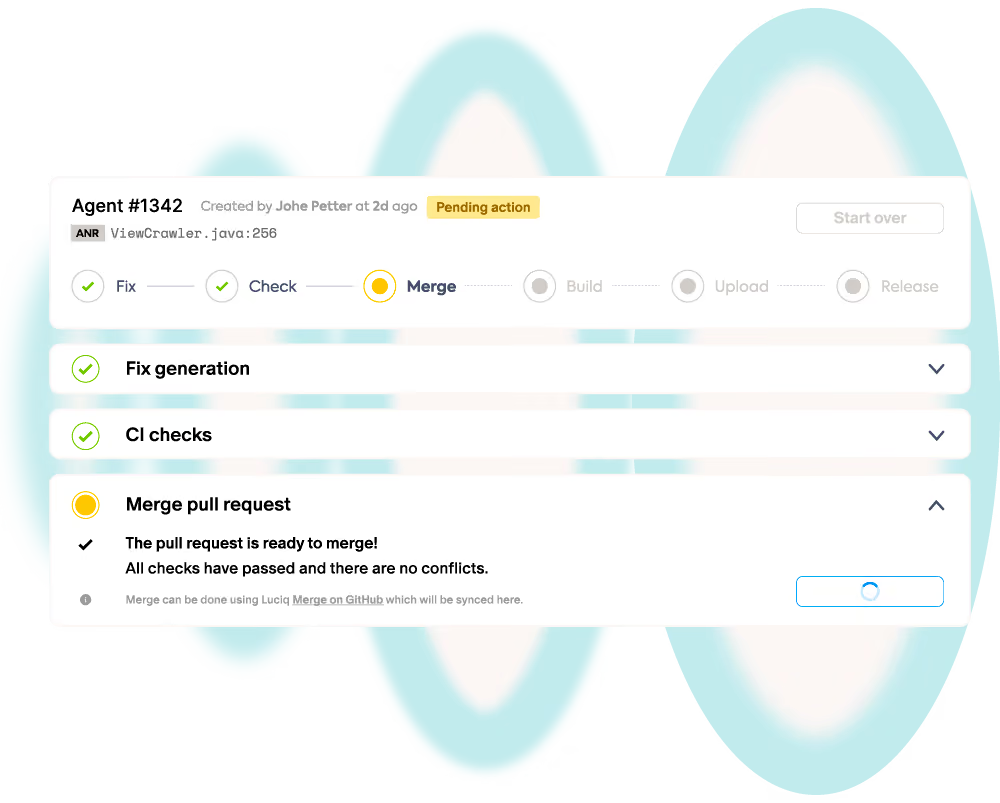
Flip it on and get a pull request ready for review, a fix prepared for the issue, before anyone opens the dashboard.
See Autopilot

Prioritize by business impact
Rank every issue by the revenue, retention, or conversion it moves, so you and your agents always work the one that matters most.
See the Companion

Bring your own AI agent
Pipe any issue, with full context, into Claude, Cursor, or your own framework over MCP, and act on it where you already work.
Browse integrations
The context moat
Built for the context mobile AI builders can't get anywhere else
An agent is only as good as the data it can reach. We capture more signal, at more depth, than anyone else, and every signal ties back to the business outcome it moves.
Breadth of signals
Mobile-specific technical, user engagement, business outcome, and sentiment signals, out of the box, and fully customizable.
Depth in every signal
Occurrences view, full logs, session view, and the connections between signals, drill all the way to the bottom.
100% capture, no sampling
Your agent sees the full picture, never a lucky sample. We built the collection and storage so we don't have to sample.
Replication-ready
Everything an agent needs to replay an issue on a simulation, reproduce it, and validate the fix before it ships.
A token-efficient intelligence layer
Aggregated to exactly what's needed, with the option to dig deeper, so agents get the signal without blowing the MCP token bill.
End-to-end tracing
Tie a mobile issue to your backend and analytics through deep integrations, the full path, not just the client side.
Every crash caught, the moment you integrate.
No instrumentation plan, no test scripts, no waiting on a QA pass. Drop in the SDK and detection, from crashes to AI-caught visual issues, turns on automatically.
1
One SDK, every platform
iOS, Android, React Native, and Flutter, one lightweight integration, minutes to ship.
2
Detection runs out of the box
Crashes, ANRs, OOMs, hangs, and AI-detected visual issues start flowing in, no manual setup.
3
Root cause attached automatically
Every issue lands with stack traces, repro steps, and session replay, ready for the Companion to fix.
If it isn't captured, it can't be fixed.
Capture 100% of sessions at the device edge, every crash, every slow span, every user report, ready for your team and every agent in your stack.