


You have about two seconds before your user decides your app is slow. Not broken. Just slow. And once that impression sets in, it's hard to shake. They'll expect every tap, every scroll, and every screen transition to feel just as sluggish as that first launch.
That first launch is called a cold start, and it's one of the most consequential performance moments in your app's lifecycle. We’ll break down what a cold start actually is, why it gets slow, how it differs across Android and iOS, and what you can do to keep yours fast.
Cold, Warm, and Hot Starts: What's the Difference?
App launches come in three types, each reflecting a different state of your app in device memory.
Cold start is the from-scratch launch. It happens when a user opens your app for the first time since booting their device, or after force-quitting it. The OS has to do everything from zero: create the app process, spin up the runtime, initialize your app object, build the main activity or view controller, and render the first frame. Nothing is cached and nothing is pre-warmed. This is the slowest launch type, and it's the one users encounter most often in real-world conditions.
Hot start is the opposite. Your app's process is already running in memory, and the system just needs to bring it to the foreground. The activity and views are still intact. The OS only has to re-render the UI. This is fast, often under a second, and users barely register it.
Warm start sits in the middle. The process might still be alive in the background, but the activity was destroyed because the user backed out and the OS reclaimed memory. Your app has to recreate the activity but skips the expensive process initialization phase.
The key takeaway here is to always optimize for cold start. It's the hardest case, and improving it tends to lift warm start performance along with it.
Why Cold Start Benchmarks Matter More Than You Think
Here's what the official guidance says. Android Vitals flags the following startup times as excessive:
- Cold start at 5 seconds or longer
- Warm start at 2 seconds or longer
- Hot start at 1.5 seconds or longer
The important thing to understand is that those are thresholds for "this is a problem," not targets to aim for. In practice, most mobile teams shoot for a cold start under 2 seconds on a mid-range device. That's the threshold where a launch actually feels instant to a human. Exceeding it means your app's Play Store visibility can take a direct hit, since Android Vitals data influences how Google ranks your app in search results.
On iOS, Apple recommends your app render its first frame in under 400ms, with the general expectation that users find a total launch time of 1 to 2 seconds acceptable before frustration sets in.
If your cold start is creeping past 2 seconds on real devices, you have a problem worth fixing sooner rather than later.
What Actually Happens During a Cold Start
A cold start is a multi-stage process, and understanding each stage is the only way to figure out where your launch time is actually going. The general sequence on both platforms follows the same pattern:
- The OS creates the app process and initializes the runtime
- Your app object is created
- The main thread launches
- Your first activity or view controller is set up
- The UI is inflated and drawn to screen
iOS Cold Start Stages
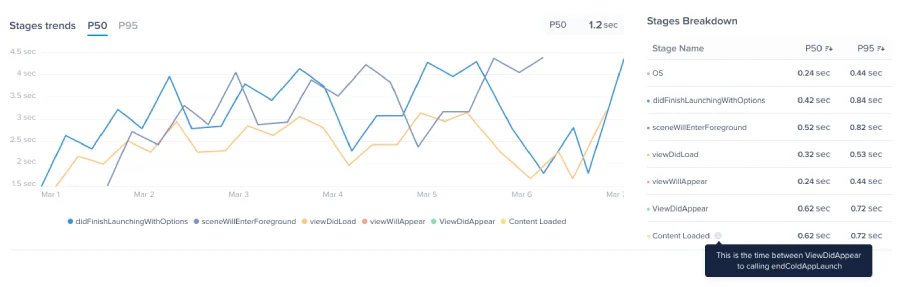
Luciq monitors the following lifecycle stages during an iOS cold launch.
- OS stage is when the system does its initialization work before your code even runs. This typically accounts for around 100ms and is largely outside your control.
- didFinishLaunchingWithOptions is called when your app is done loading and ready to be used. This is where you finalize initialization and configure the app before the first screen appears.
- sceneWillEnterForeground is called if your app uses the UIScene lifecycle, which most modern iOS apps do.
- viewDidLoad is when the view controller is loaded into memory and your custom initialization runs.
- viewWillAppear is called when the view is about to be added to the view hierarchy, before any animations have been configured.
- viewDidAppear signals that the view is now live on screen. By default, Luciq treats this as the end of the launch. You can configure a custom endpoint using the EndAppLaunch API if your app loads additional data before it's truly interactive.
Android Cold Start Stages
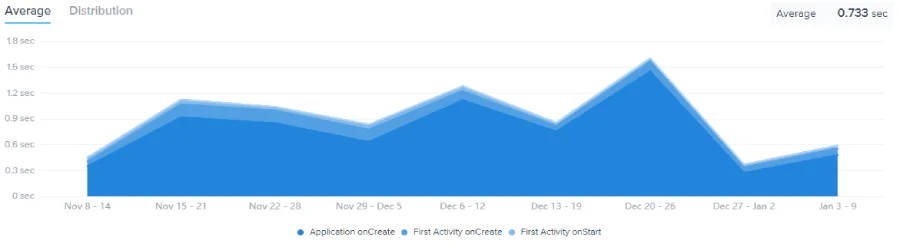
On Android, Luciq tracks these key stages.
- Application onCreate is when the system creates the application object. This is one of the most common places where slow cold starts originate, since it's a natural place to initialize everything at once.
- First Activity onCreate is when your main activity is created and the UI structure is established.
- First Activity onStart is when the activity becomes visible and begins its transition to the foreground.
Why App Cold Starts Get Slow
This is the part the benchmarks don't tell you. Knowing that your cold start takes 4 seconds is a starting point. Knowing why is how you actually fix it. These are the most common culprits.
- Heavy work in Application.onCreate() on Android is the single most common cause of slow Android cold starts. This method runs on the main thread before anything is visible to the user, so every synchronous operation you put here blocks the UI completely. If you have five analytics SDKs and a crash reporter all initializing in sequence, your users feel every millisecond of it.
- Synchronous I/O on the main thread causes problems on both platforms. Whether it's reading from disk, accessing SharedPreferences, or making a blocking network call during startup, any synchronous I/O on the main thread freezes the UI until it completes.
- Third-party SDK sprawl adds up fast. Every SDK you initialize at launch sets up its own threads, reads config files, and may make network calls. One SDK adding 200ms isn't a crisis. Five of them initializing in sequence is a real problem.
- Large and complex view hierarchies take longer to inflate and measure on screen. On Android, deeply nested layouts are a frequent offender. On iOS, loading too many subviews before the first frame appears has a similar effect.
- Excessive dynamic library loading on iOS is a pre-main cost that grows with every additional dylib your app links. As third-party frameworks accumulate, the time before your code even runs increases noticeably.
- No regression baseline to compare against is subtler but just as damaging. If you're not tracking cold start time continuously across releases, you won't notice when a new dependency or refactored init sequence adds 300ms to your startup. By the time users start complaining, you're already behind.
Cold Start Performance on iOS vs. Android
Both platforms move through similar conceptual phases, but the underlying mechanics differ in ways that matter for how you approach optimization.
On Android, the biggest performance lever is Application.onCreate(). It's the first code you fully control, and it runs entirely before anything appears on screen. Android also gives you strong platform-level visibility through Android Vitals in the Play Console, which automatically collects field data from users' devices with no extra instrumentation needed. The TTID (Time to Initial Display) and TTFD (Time to Fully Drawn) metrics are especially useful because they distinguish between first frame visible and the app actually being usable, which are often very different things.
On iOS, the pre-main phase is a more significant factor. This is the time before your code runs at all, driven by dylib loading, class registration, and Objective-C runtime initialization. Apple's MetricKit and Xcode Organizer give you visibility into production launch times, but the levers for improving pre-main performance are more architectural in nature: reducing dynamic library count, favoring static frameworks, and keeping your binary lean.
The bottom line is that optimization strategies aren't fully portable between platforms. What fixes your Android cold start won't necessarily fix your iOS one, and vice versa.
How to Make Your Cold Start Faster
These are the highest-leverage improvements you can make, roughly ordered by impact.
- Defer everything non-critical. Anything that doesn't need to happen before the first frame appears should be pushed to after it. Initialize analytics SDKs, crash reporters, and non-essential services lazily on a background thread after the first screen loads, or on first use.
- Audit every SDK initialization at startup. Make a list of everything you're initializing at launch and honestly ask whether it needs to run before the user sees anything. Most of the time, it doesn't. Use Android's App Startup library to control init order and timing. On iOS, audit what's happening in your AppDelegate before returning from didFinishLaunchingWithOptions.
- Move I/O off the main thread. If you're reading from disk or a local database during startup, do it asynchronously. Show a skeleton state or loading indicator while the data loads rather than holding up the entire launch sequence.
- Simplify your view hierarchy. On Android, flatten your layouts using ConstraintLayout instead of nested linear layouts. On iOS, avoid loading complex subview trees before viewDidAppear fires.
- Measure on real, mid-range devices. Your development machine or a flagship device will hide problems that your users on mid-range hardware will feel directly. Profile on the kind of device your median user actually has, not your best-case device.
- Track cold start continuously across releases. A new library, a refactored init sequence, or a seemingly unrelated architectural change can quietly add 300ms to your startup time without anyone noticing until it shows up in user reviews.
Why App Cold Starts Are Hard to Debug Without Visibility
Here's the honest reality of cold start performance. It's not a one-time problem. Cold starts get slower over time as apps grow, accumulating more features, more SDKs, and more initialization work across every release cycle. Because the regression usually happens gradually, it often goes unnoticed until it's already affecting user retention.
This is where most teams hit a wall. You can profile your cold start in a lab on your device on a good day. But what's happening for the 40% of your users on three-year-old mid-range hardware, in low-memory conditions, in markets with slower storage? You don't know, because you're not measuring it in production.
Traditional APM tools tell you that your cold start is slow. They give you a number and maybe a stage-by-stage breakdown. That's a start, but it still leaves you with the hard work of correlating the data, reproducing the issue, and figuring out exactly which release introduced the regression.
How Luciq's Agentic Mobile Observability Changes the Equation
Luciq is built on the premise that showing you data isn't enough. It needs to help you understand and act on it.
When a cold start regression surfaces, Luciq's agentic observability layer doesn't just flag the metric. It correlates the regression against release history, affected device segments, OS versions, and stage-level initialization data to surface why the launch got slower and when it started. Instead of spending hours in traces trying to isolate the issue, you get a clear path to the root cause.
Request a demo to see how Luciq can help you stay on top of cold start performance across every release.