


Mobile apps are no longer just a channel. For most businesses, they are the product. With over six billion smartphone users worldwide, the mobile app is where customers transact, communicate, and form lasting opinions about a brand. When that experience breaks down, users do not wait around. They uninstall.
This puts mobile engineering teams under constant pressure to ship reliable, high-performance experiences at speed. Yet many teams still operate with limited visibility into how their apps actually behave in production, across real devices, real networks, and real usage patterns that no test environment can replicate.
Mobile observability closes that gap. It is the practice of continuously collecting and analyzing data emitted by mobile applications in the wild, giving engineering teams the visibility to detect, diagnose, and resolve issues before they impact users at scale. As mobile complexity grows and AI unlocks new levels of automation and intelligence, observability has shifted from a nice-to-have to a core engineering competency. Understanding it is the first step to building apps that users can genuinely rely on.
What is Mobile Observability?
Mobile observability is the ability to understand what is happening inside your mobile application in production, by analyzing the data it continuously emits. It gives engineering teams the visibility to answer a deceptively simple question: is our app working well for real users, right now?
That question is harder to answer than it sounds. A mobile app runs on hardware you do not control, on networks you cannot predict, across an enormous variety of devices and operating system versions. The only reliable way to know what users are actually experiencing is to build your app to tell you.
Understanding what observability means in practice requires distinguishing it from traditional monitoring. Monitoring is reactive. You define thresholds, set up alerts, and wait for something to go wrong. Observability is proactive. It captures rich, continuous data from your application so you can investigate any condition, including ones you never anticipated. For mobile teams, this distinction matters enormously. New OS versions, device models, and network conditions constantly introduce failure modes that no one predicted during development. Observability gives you the tools to find and understand them quickly, without waiting for users to report that something is broken.
Why Mobile Observability Is a Different Challenge Entirely
Mobile observability is not simply backend observability applied to a smaller screen. The environment is fundamentally different, and that difference demands a dedicated approach.
The most significant distinction is control. On the server side, you own the infrastructure, the hardware, OS, network configuration, and runtime conditions. Mobile apps run on hardware you never touch, on networks you cannot predict, in conditions you cannot replicate in a test environment.
The key challenges unique to mobile include:
- Device and OS fragmentation: Your app runs across thousands of device and OS combinations. A bug that only appears on a specific Android manufacturer's custom OS build, or a memory issue on an older iPhone, can go undetected without broad real-world instrumentation.
- Network variability: Mobile users move between Wi-Fi, cellular, and offline states, sometimes mid-session. Requests that succeed in testing can silently fail in production.
- Platform constraints: Strict privacy regulations, background execution limits, and the real-world cost of battery drain and data usage mean you cannot instrument mobile apps the same way you would a backend service.
The result is that mobile engineering teams frequently operate with incomplete information about a highly variable environment. Platforms like Luciq are purpose-built to close that gap, using agentic AI to surface and make sense of signals that traditional tools miss entirely.
The Core Signals That Make Mobile Observability Work
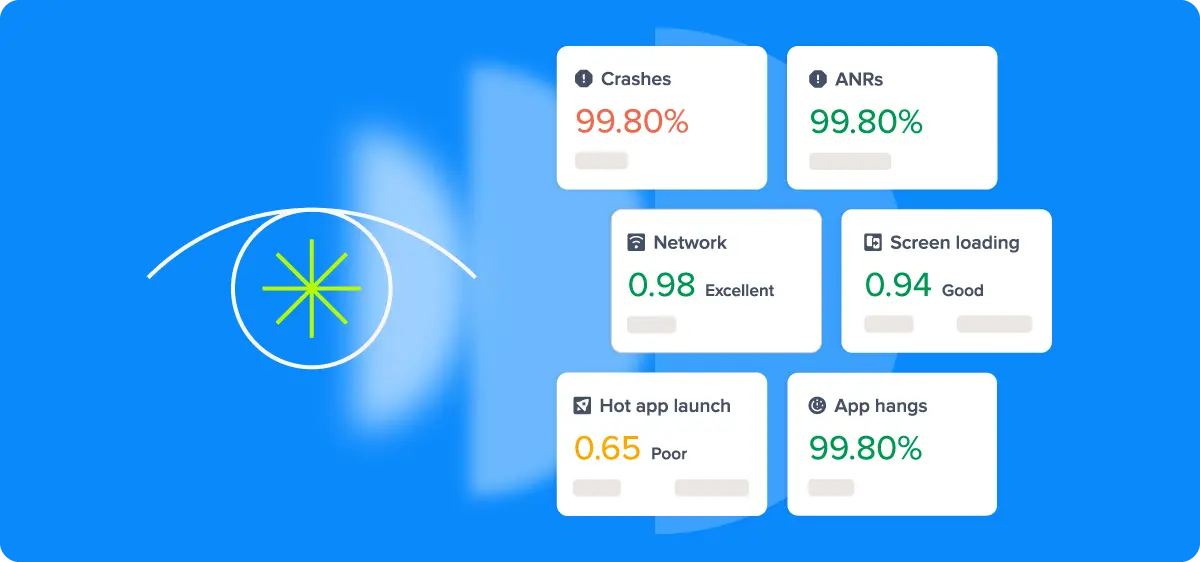
Effective mobile observability relies on four categories of data, each capturing a different dimension of app health. Used in isolation, each tells a partial story. Used together, they give engineering teams a complete picture of what users are actually experiencing.
- Crash Reporting and Error Tracking: Not all errors are equal. Fatal crashes, ANRs (Android Not Responding events), and handled exceptions each represent a different level of severity and require a different response. Treating them as a single category means missing the nuance that separates a minor edge case from a widespread user-facing failure.
- Performance Monitoring: This covers app startup time, frame rendering, UI jank, memory consumption, and battery impact. These metrics connect directly to user experience. A one-second delay in app startup or a janky scroll interaction may not trigger an error, but it shapes how users perceive and ultimately rate your app.
- Network Observability: Mobile network conditions are unpredictable by nature. Tracking request latency, failure rates, and payload sizes across real-world network conditions reveals performance bottlenecks that controlled testing environments will never expose.
- Session Replay 2.0 and Real User Monitoring: RUM captures what actual users experience on actual devices, in real time. Unlike synthetic testing, which validates expected behavior in controlled conditions, RUM surfaces the unexpected: the slow screen transition on a mid-range Android device, the checkout failure on a specific carrier network.
The value of these signals compounds when they are correlated. A spike in network failures followed by a surge in app abandonment tells a richer story than either data point alone. Building an observability practice means not just collecting these signals, but connecting them in ways that make root cause analysis faster and more precise.
How Mobile Observability Data Gets Collected
Knowing what signals to collect is only half the equation. How you collect them directly impacts data quality, engineering overhead, and the accuracy of what you see in production.
Instrumentation generally falls into two approaches. Auto-instrumentation uses an SDK or agent to automatically capture predefined signals like crashes, network requests, and screen load times with minimal setup. Manual instrumentation has engineers explicitly define what to track and where, adding custom events and traces at specific points in the code for richer, more contextual data. Most mature setups combine both: auto-instrumentation provides the foundation, and manual instrumentation fills in the gaps that matter most to your product and user journeys.
Two additional considerations shape how effectively data gets collected:
- Sampling strategies: Capturing every event from every user is rarely practical at scale. Intelligent sampling prioritizes high-value events, error states, and edge cases, preserving the signal that matters without the infrastructure overhead.
- Privacy and data minimization: Mobile apps are subject to regulations like GDPR and CCPA, as well as platform-level privacy frameworks from Apple and Google. Responsible instrumentation means collecting only what is necessary and being deliberate about what user data leaves the device.
Getting instrumentation right is what separates teams that have data from teams that have useful data.
How to Build Mobile Observability Practices That Scale
How you build and evolve your mobile observability practices determines whether it delivers lasting value or becomes another underused dashboard. Here are a few key foundational principles that make the difference.
- Start with the user experience, not the infrastructure: It is tempting to instrument everything and optimize later. A more effective approach is to identify the user journeys that matter most, checkout flows, onboarding, core product interactions, and instrument those first. This ensures your observability practice delivers signals that are immediately actionable rather than data for its own sake.
- Embed observability into your release process: Observability is most valuable when it is part of how you ship, not something you consult after a problem surfaces. Tracking key health metrics version by version makes it possible to catch regressions early, before they reach a significant portion of your user base.
- Bridge engineering and product with shared visibility: Mobile app health is not purely an engineering concern. When product and engineering teams share the same dashboards and speak the same language around performance, crash rates, and user impact, issues get prioritized faster and fixed with more context.
- Treat instrumentation as a living system: Mobile apps evolve continuously, and so do the failure modes that matter. Instrumentation that was sufficient six months ago may miss entirely new classes of issues introduced by a platform update or a new feature. Revisiting and refining what you collect should be a regular part of your engineering workflow.
A mature mobile observability practice is not built overnight, but teams that invest in it systematically find themselves spending less time firefighting and more time building.
Turning Mobile Observability Signals Into Engineering Action
Collecting mobile observability data and building good practices is a starting point, not a destination. The real value comes from transforming raw signals into decisions that improve app quality and user experience. This is where many mobile observability practices stall. Teams have dashboards, but lack the workflows to act on what those dashboards are telling them.
The bridge between data and action typically runs through three areas:
- Connecting signals to business outcomes: Technical metrics only become meaningful when they are tied to user and business impact. A 20% increase in app startup time is an engineering concern. That same increase correlated with a drop in session length and a rise in one-star reviews is a business problem that demands immediate attention. Building this connection between technical signals and outcomes like retention, conversion, and store ratings is what earns observability its seat at the product table.
- Alerting without noise: Effective alerting is harder than it looks. Alert on too little and regressions slip through. Alert on too much and teams develop alert fatigue, eventually tuning out the notifications that matter. The goal is precision: alerts that fire when something meaningful changes, with enough context attached to make the path to investigation clear.
- Release health monitoring: Every new release is a risk. Observability should be embedded in the release process so that teams can validate app health version by version, catching regressions early before they compound across a growing user base.
As app complexity scales and data volumes grow, executing on all three of these areas manually becomes increasingly difficult. That tension sets the stage for what AI is beginning to make possible in mobile observability.
Mobile Observability in the Age of AI
The volume and complexity of mobile telemetry has grown to a point where manual analysis is no longer sustainable. An app with millions of active users generates signals across crashes, performance metrics, network events, and user interactions, spanning thousands of device and OS combinations. No team can meaningfully process that at human speed.
AI addresses this in three meaningful ways:
- Anomaly detection: Rather than relying on manually configured thresholds, AI learns your app's normal behavior patterns and automatically surfaces deviations that warrant attention, accounting for the constant shifts across app versions, device types, and usage patterns.
- Root cause analysis: Traditional tools tell you that something went wrong. AI-powered tools help you understand why, by correlating signals across crashes, network failures, and user flows to identify the underlying cause rather than just the symptom.
- Agentic observability: The most significant evolution. Rather than presenting data for human interpretation, agentic systems autonomously correlate signals, generate hypotheses, and recommend or initiate remediation actions without waiting for an engineer to prompt them.
See What Agentic Mobile Observability Can Do for Your Team
Mobile apps are only getting more complex. User expectations are only getting higher. And the window to detect and resolve issues before they affect retention and revenue is only getting shorter. The teams that will win are those that move beyond passive monitoring and build observability practices that are as intelligent and dynamic as the apps they support.
That is exactly what Luciq is built for. As an agentic mobile observability platform, Luciq goes beyond surfacing signals and waiting for engineers to act. It autonomously investigates anomalies, correlates signals across crashes, performance metrics, and network events, and helps teams get to the root cause faster than any manual workflow can.
Request a demo and experience what agentic mobile observability can do for your team.