


Observability used to mean watching your servers. Same input, same output, same metrics to monitor. That worked fine when systems were predictable.
AI systems are not. An agentic application chains together models, tools, and decision points, and its behavior shifts depending on what it encounters at runtime. When something breaks, traditional monitoring tells you something went wrong, but not where in that chain or why.
That is exactly the problem agentic AI observability tools are built to solve. The space now covers everything from LLM pipeline evaluation to full-stack enterprise platforms to purpose-built mobile AI observability. We’ll cover the most relevant tools, what each does well, where it falls short, and who it is best suited for.
The Top Agentic AI Observability Tools
Not all agentic AI observability tools are created equal. Some of the platforms here started as general-purpose infrastructure monitoring tools and have layered AI capabilities on top. Others are agentic AI observability tools built from the ground up for LLM pipelines and agentic workflows. And one tool, Luciq, was purpose-built for mobile.
That distinction matters when you’re evaluating options. A tool that works brilliantly for monitoring a distributed backend might provide very little useful information about what is happening inside an LLM chain or a mobile app running on thousands of different devices. The right fit depends on what you are actually building and where your blind spots are.
Each tool below is assessed on what it does well, where it has limitations, and what kind of team or use case it is best suited for.
Luciq
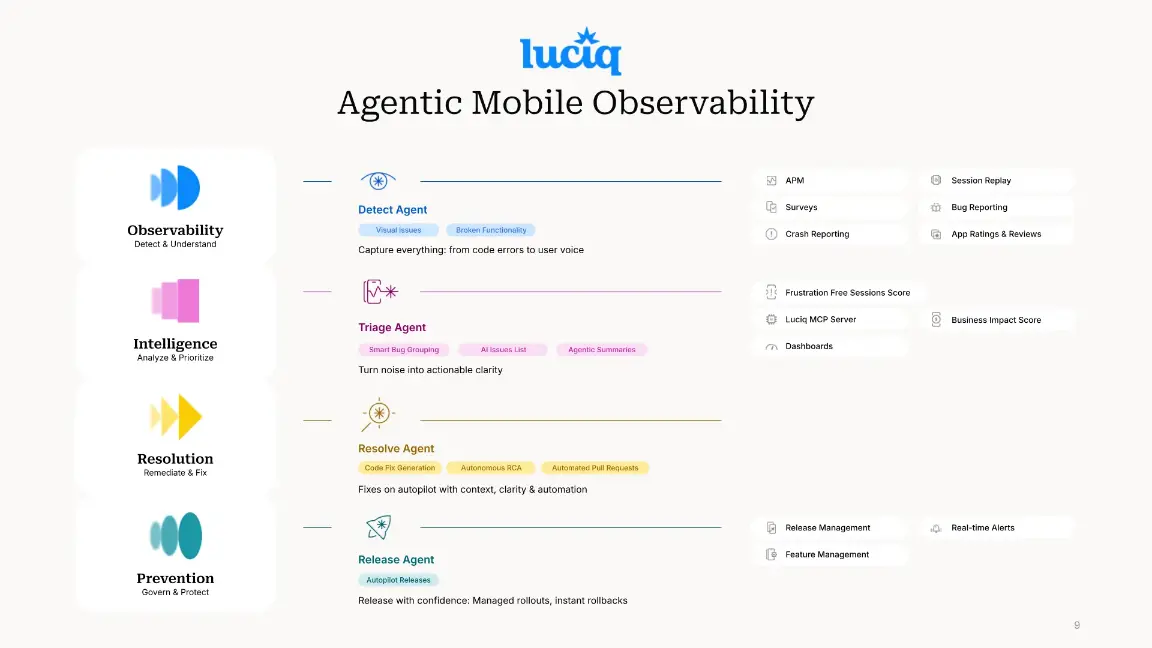
Luciq is the first and leading Agentic Mobile Observability platform, purpose-built for the unique complexity of mobile apps. Most observability platforms treat mobile as an afterthought, bolting on a crash reporting SDK while focusing their real intelligence on backend and infrastructure signals. Luciq takes the opposite approach.
Where traditional tools stop at alerting, Luciq deploys four AI-powered capability layers that work across the entire mobile maintenance lifecycle:
Observability captures everything that affects user experience: crashes, performance degradation, network failures, visual glitches, broken functionality, and real user interactions via Session Replay. It surfaces issues that generic backend-focused tools miss entirely, including the silent killers like UI hangs and slow launches that drive uninstalls without ever generating a crash report.
Intelligence eliminates the reproduction loop. Rather than leaving engineers to manually piece together fragmented signals, it autonomously correlates data across sessions, devices, and OS combinations, groups issues with smart bug clustering, and delivers AI-generated root-cause briefs with reproduction steps, turning noise into actionable clarity in seconds.
Resolution goes beyond diagnosis. It analyzes the full contextual picture (session replays, console logs, and user flows) to generate precise fix suggestions and draft automated pull requests for developer review. What previously took days of forensics gets compressed into minutes.
Prevention governs every deployment. It monitors stability per feature flag in real time, enforces performance thresholds, and can automatically halt or roll back a faulty release before it spreads across your user base, eliminating launch-day risk without manual intervention.
Together, these four layers cut maintenance workloads by 30–50%, accelerate time-to-fix, and free engineering teams from reactive firefighting to focus on building what matters.
Best for: Mobile engineering teams that need more than crash reporting and teams ready to shift from passive monitoring to autonomous action across the full maintenance lifecycle.
Worth knowing: Luciq is not trying to replace your backend observability stack. It is built to complement it through its MCP Server, which integrates high-fidelity mobile telemetry directly into your broader enterprise observability architecture, closing the client-side visibility gap that general-purpose tools consistently leave open.
Datadog
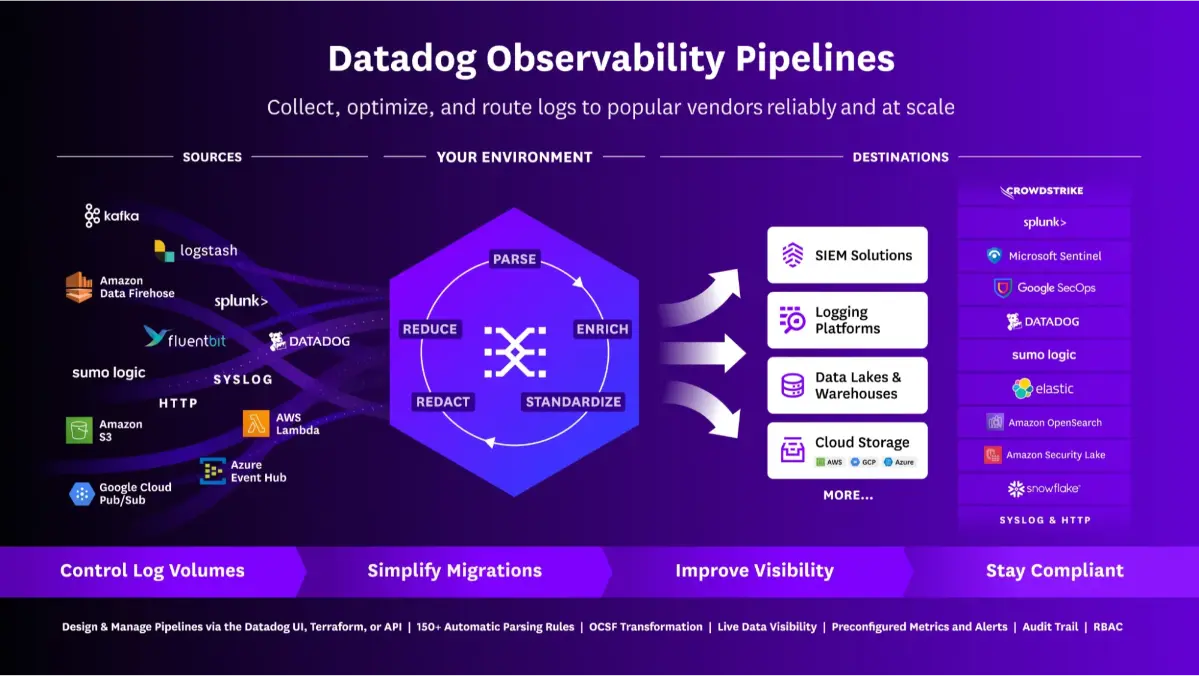
Datadog started as an infrastructure monitoring tool and has steadily expanded into a full-stack observability platform covering logs, traces, metrics, and now AI-powered analysis. If your team is already running Datadog for backend and infrastructure observability, its AI capabilities are a natural next step rather than a separate tool to evaluate.
Its agentic features center around Watchdog, Datadog's AI engine, which continuously monitors your environment for anomalies and surfaces potential root causes without requiring manual investigation. It also offers LLM observability through its AI Observability product, which provides tracing and evaluation for AI pipelines built on models from OpenAI, Anthropic, and others.
Best for: Teams that already live in the Datadog ecosystem and want to extend their existing observability practice into AI workloads without adopting a separate platform.
Worth knowing: Datadog's breadth is also its trade-off. It covers a lot of ground, but its agentic AI capabilities are not as deep as observability tools purpose-built for those environments. Pricing also scales quickly at high data volumes, which catches some teams off guard.
Dynatrace
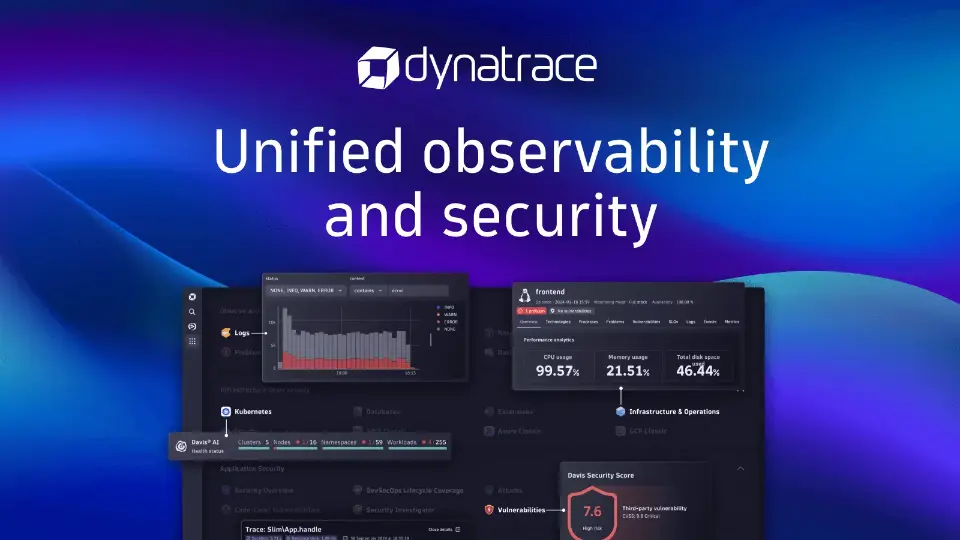
Dynatrace covers the full observability stack including infrastructure, applications, user experience, and increasingly, AI pipelines. Its recently introduced Davis AI copilot extends these capabilities with natural language querying, letting engineers ask questions about their environment in plain English and get actionable answers back.
Best for: Large engineering teams and enterprises managing complex, distributed systems that need deep autonomous analysis rather than just smarter alerting.
Worth knowing: Dynatrace is a serious platform with a serious price tag and implementation overhead to match. It is probably overkill for smaller teams or early-stage products, but for the right scale it is one of the most capable options available.
Honeycomb
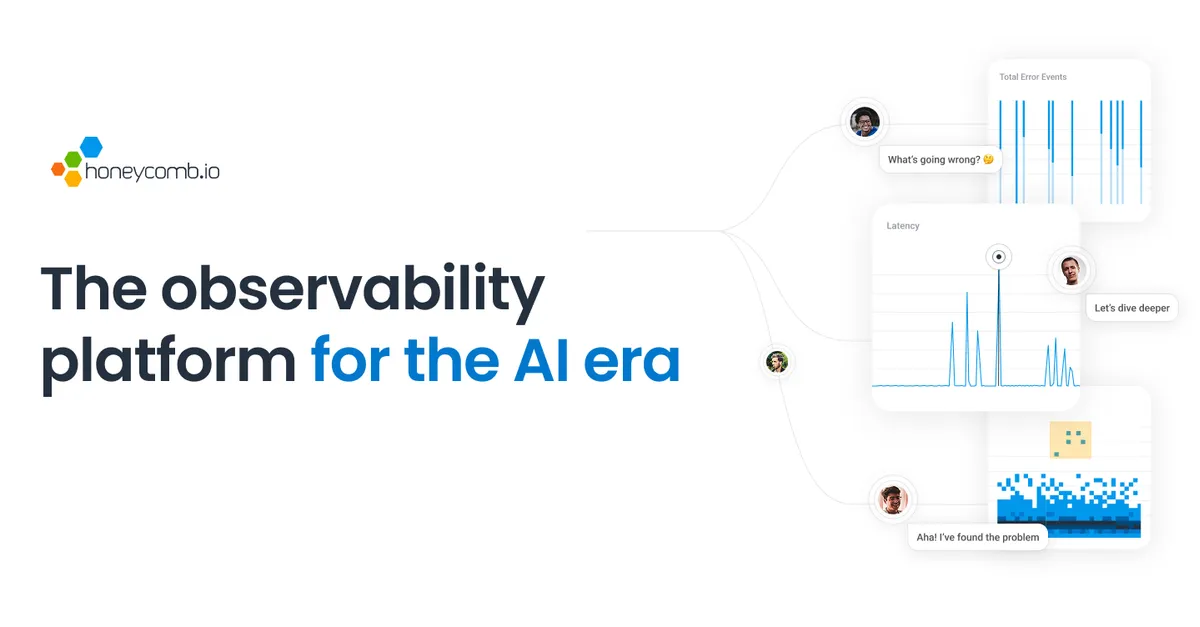
Honeycomb was built around one core idea: instead of pre-aggregating data into fixed dashboards, you should be able to ask any question about your system in real time and get a meaningful answer back. Its AI assistant translates plain language queries into Honeycomb's query syntax automatically, lowering the barrier for teams that want analytical depth without everyone needing to master the tooling. Its high-cardinality data model also handles the kind of complex, nested traces that agentic AI applications produce better than most traditional observability tools.
Best for: Engineering teams that prioritize deep, flexible analysis over pre-built dashboards, particularly those working with complex distributed systems or agentic AI workflows that generate rich trace data.
Worth knowing: Honeycomb has a learning curve. Its query-driven approach is powerful once it clicks, but teams accustomed to more prescriptive dashboard tools may find the initial adjustment takes some time. Among agentic AI observability tools, it is also one of the more backend-focused, so mobile visibility is limited.
New Relic
New Relic is a mature, well-documented full-stack observability platform that most engineers have run into at some point. It covers infrastructure, logs, traces, and user experience, and has more recently added AI-assisted analysis through New Relic AI, which lets teams query their telemetry in natural language and get summarized findings during incident investigation.
A shift to consumption-based pricing has also made it more accessible for smaller teams than it used to be.
Best for: Teams that want a proven full-stack observability platform with solid AI assistance built in, particularly those with a strong application performance monitoring background.
Worth knowing: New Relic's AI capabilities are more assistive than truly agentic. It helps engineers investigate faster but doesn't autonomously correlate signals and surface root causes the way more specialized platforms do. Mobile observability is also pretty surface-level compared to dedicated tools.
Grafana
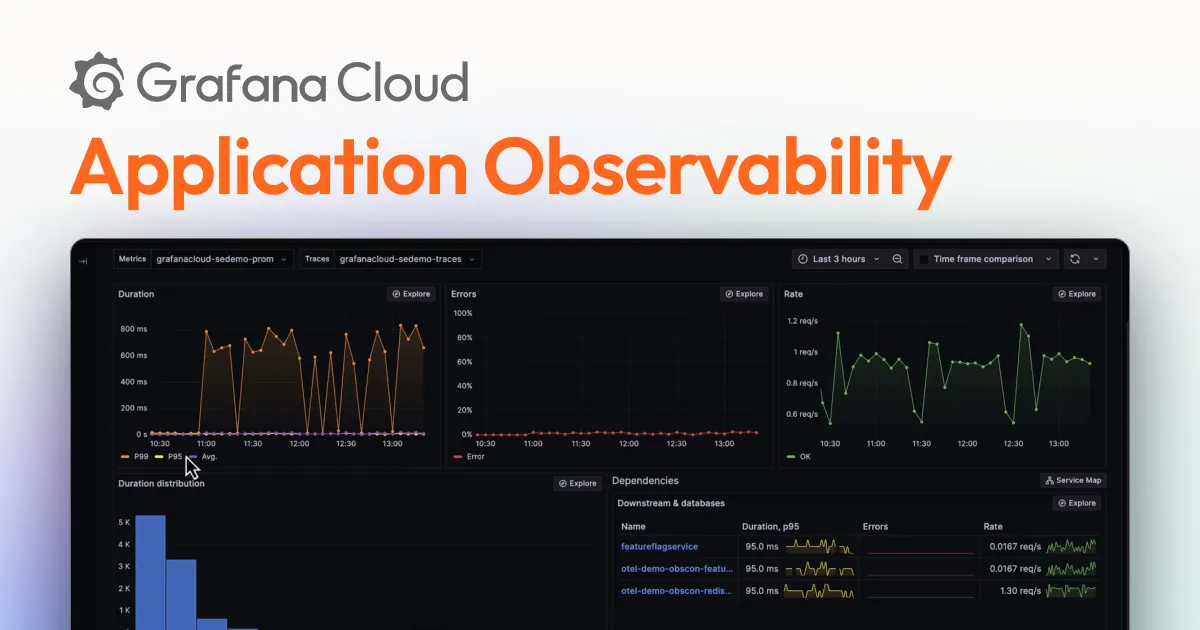
Grafana is best known as the open-source visualization layer that sits on top of data sources like Prometheus, Loki, and Tempo. Most engineering teams have encountered it in some form, even if they did not set it up themselves. Over time it has grown from a dashboarding tool into a broader observability platform through Grafana Cloud, its managed offering.
Its AI capabilities are more recent and still maturing. Grafana's Sift feature automates parts of the incident investigation process by running a series of checks across your telemetry and surfacing potential causes. It is useful, but sits closer to assisted analysis than fully autonomous investigation.
Best for: Teams already invested in the Grafana and Prometheus ecosystem who want to extend their existing setup with AI-assisted analysis rather than adopt an entirely new platform.
Worth knowing: Grafana's open-source roots are a strength and a constraint. The flexibility is unmatched, but self-managed deployments carry meaningful engineering overhead. Its AI capabilities also lag behind purpose-built platforms like Dynatrace and Datadog, so teams with sophisticated agentic observability requirements may find it falls short.
Arize AI
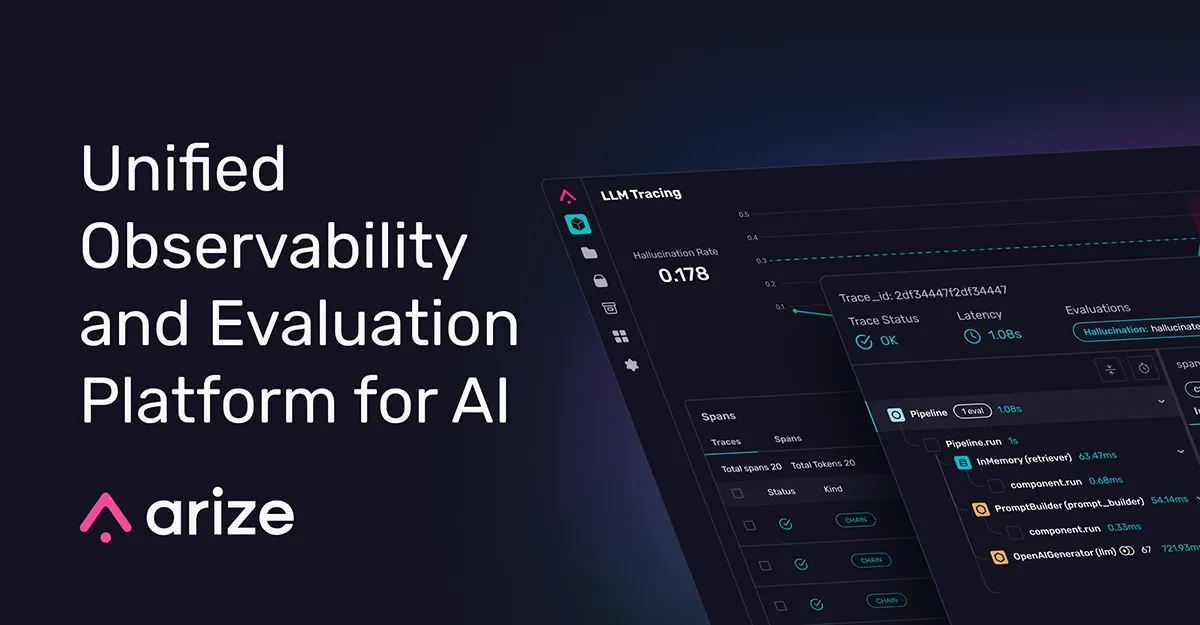
Arize's core strength is giving teams visibility into how their models are actually behaving in production. It tracks model inputs and outputs, monitors for data drift and performance degradation, and helps teams trace issues back to specific changes in data distribution or model behavior. It also supports LLM observability through Arize Phoenix, its open-source tracing and evaluation tool for AI pipelines.
Best for: Data science and ML engineering teams that need deep visibility into model performance and drift, particularly those managing multiple models in production simultaneously.
Worth knowing: Arize is purpose-built for the AI and ML layer, so it is not a replacement for broader infrastructure or application observability. Most teams will run it alongside a tool like Datadog or Grafana rather than instead of one.
LangSmith
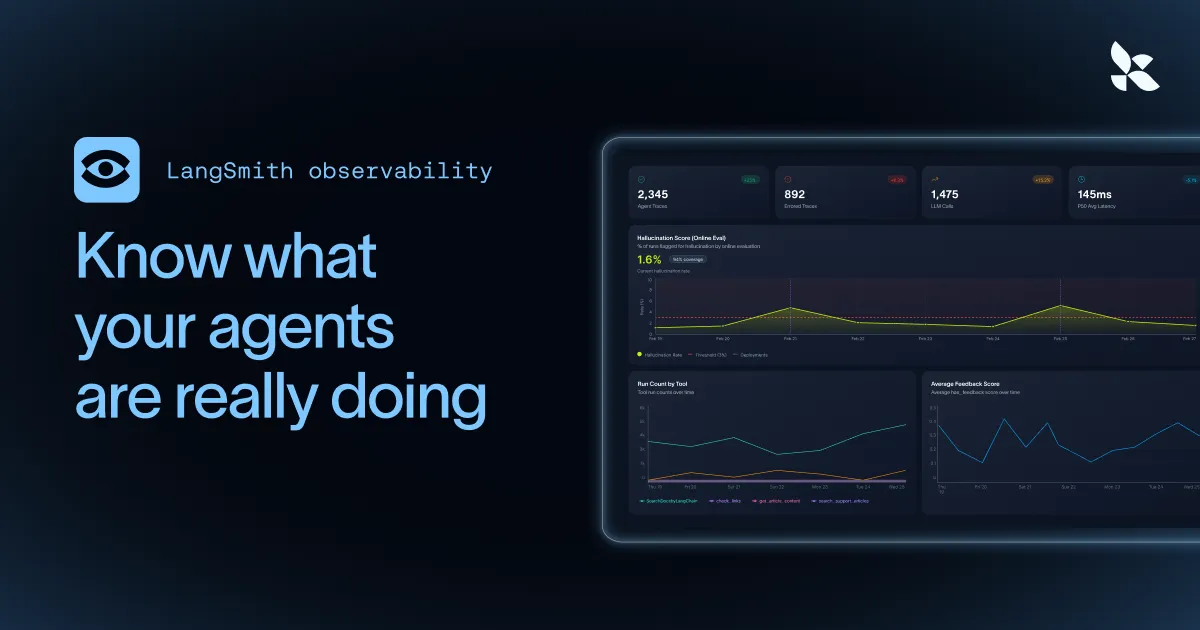
LangSmith is built by the team behind LangChain, which gives it a natural home for teams already using LangChain to build LLM applications. It focuses specifically on tracing, evaluating, and monitoring LLM workflows in production, covering the things general-purpose observability tools tend to miss entirely, like prompt behavior, chain execution, and model output quality.
Its tracing capabilities give teams a step-by-step view of how an agentic workflow executes, making it significantly easier to spot where a multi-step LLM chain breaks down or produces unexpected results.
Best for: Teams building LLM applications with LangChain or LangGraph who need detailed visibility into how their agentic workflows behave in production.
Worth knowing: LangSmith is tightly coupled to the LangChain ecosystem. If your AI stack is built on different frameworks, you will get less out of it than teams who are already in that world. It also focuses specifically on the LLM layer, so it needs to be paired with a broader observability tool for full-stack coverage.
Braintrust
Braintrust sits in the AI evaluation and observability space alongside tools like Arize and Galileo, but it leans more heavily toward helping teams build reliable evaluation pipelines for their LLM applications. It gives teams a structured way to log, score, and compare model outputs over time, making it easier to catch regressions when prompts, models, or application logic changes.
It also provides production monitoring, so teams can track how their LLM applications are performing with real users rather than just in controlled test environments.
Best for: Teams that want a structured approach to LLM evaluation alongside production monitoring, particularly those iterating frequently on prompts and model configurations.
Worth knowing: Braintrust is strong on the evaluation side but isn't a full observability platform. Like most tools in this category, it covers the AI layer and needs to be paired with broader infrastructure and application monitoring for complete coverage.
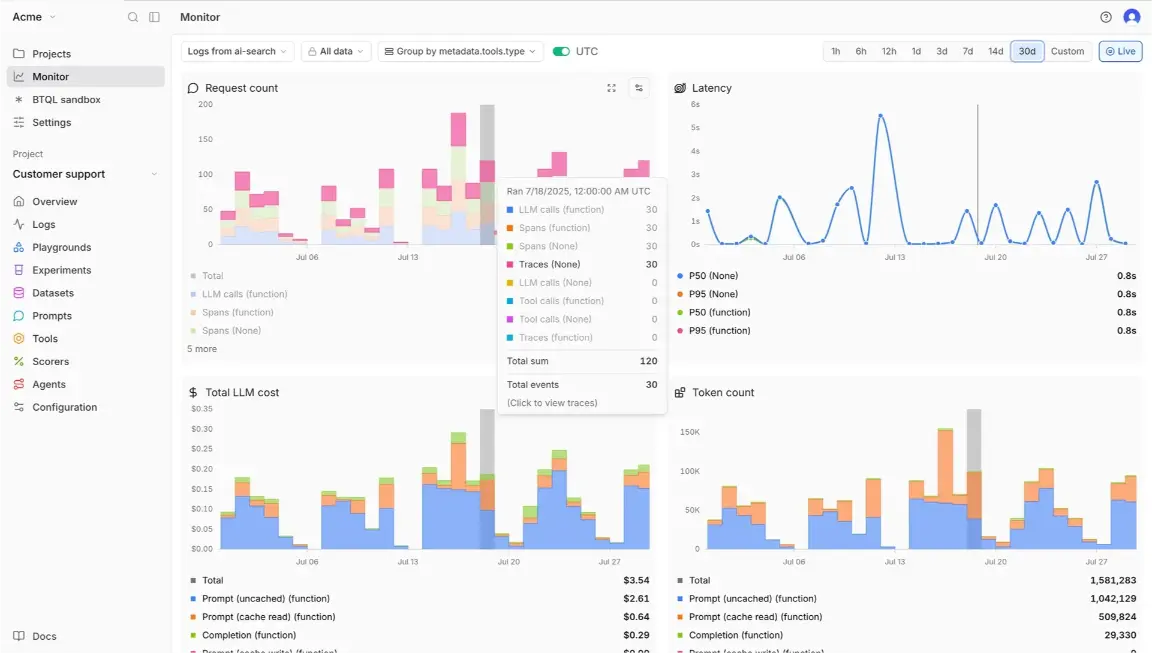
Galileo
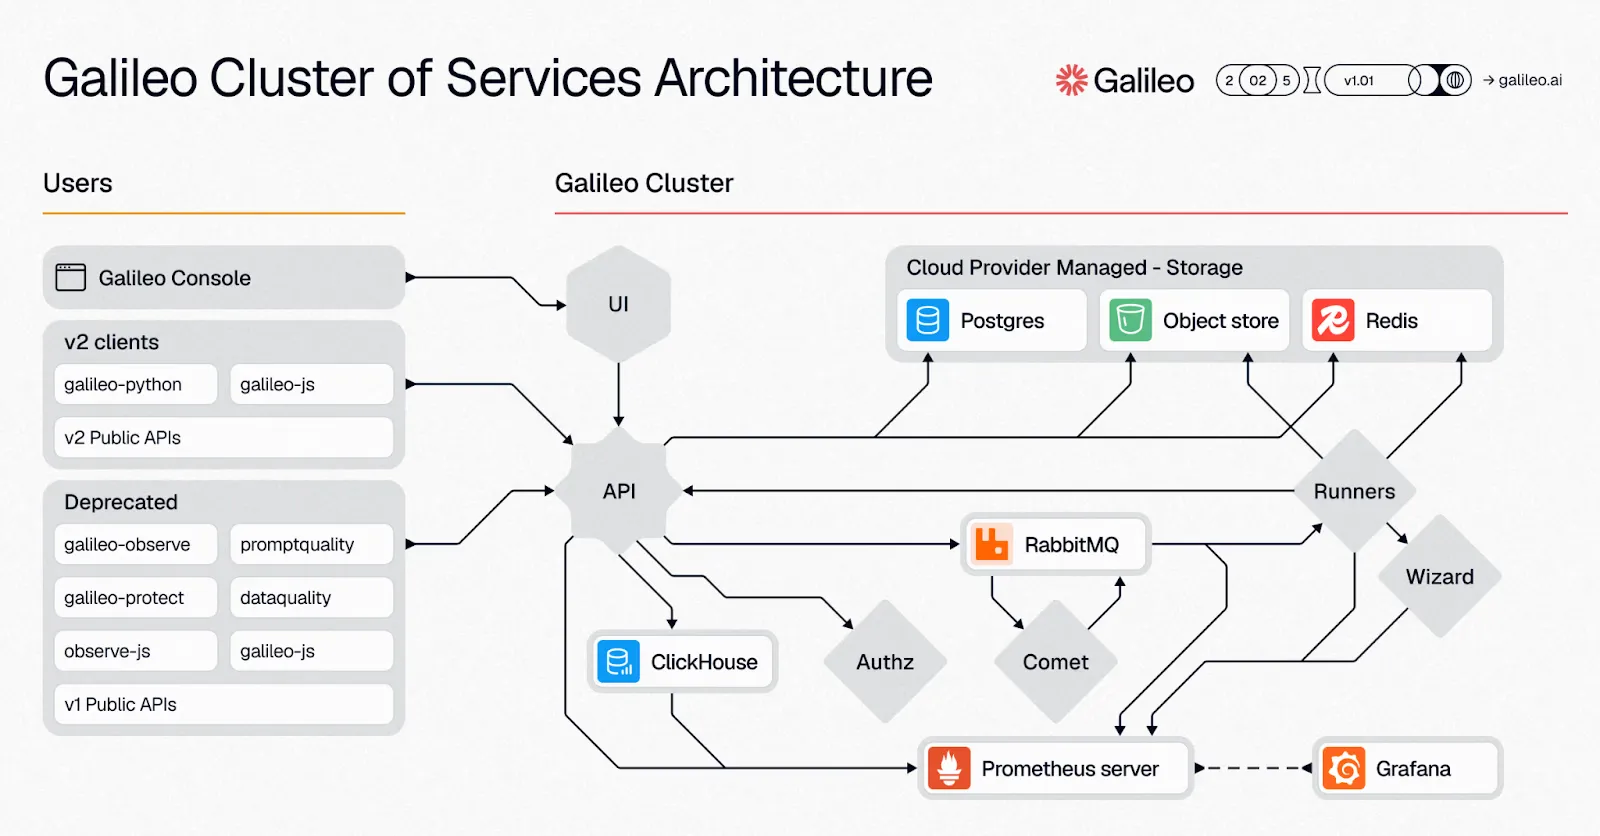
Galileo focuses on AI quality and observability, with a particular emphasis on catching the kinds of issues unique to LLM applications in production. Hallucinations, prompt instability, and inconsistent model outputs are notoriously hard to detect with general-purpose monitoring tools. Galileo was built specifically to surface them.
Its evaluation pipelines let teams define what good model behavior looks like and automatically flag deviations, making it easier to maintain output quality as models, prompts, and underlying data change over time.
Best for: Teams building LLM-powered products where output quality and reliability are critical, particularly those dealing with hallucination risk in customer-facing applications.
Worth knowing: Galileo is focused on the AI quality layer. It complements broader observability platforms rather than replacing them, so factor in the additional tooling overhead when evaluating it.
Helicone
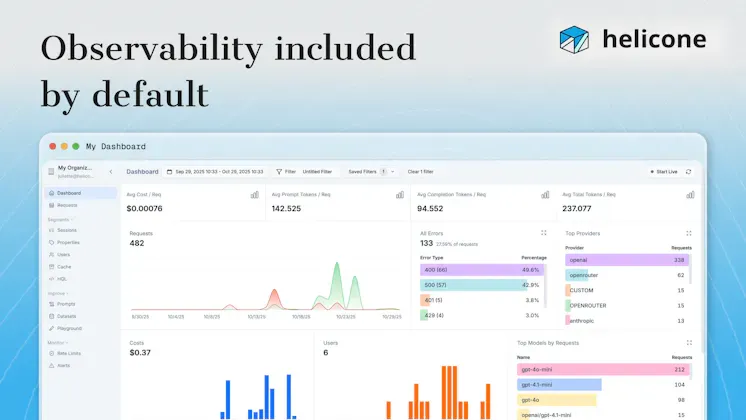
Helicone is a lightweight LLM observability tool that's grown quickly in popularity among teams building AI applications who want visibility into their model usage without a heavy setup process. It sits as a proxy between your application and your LLM provider, logging every request and response automatically with minimal code changes required.
It tracks costs, latency, and output quality across model calls, giving teams a straightforward way to monitor how their LLM applications are behaving in production without needing to instrument everything manually.
Best for: Teams that want fast, low-friction visibility into their LLM usage and costs, particularly smaller teams or early-stage products that need useful insights without a complex observability setup.
Worth knowing: Helicone's simplicity is its biggest selling point, but it's also its ceiling. It covers LLM request monitoring well but isn't a deep evaluation or root cause analysis platform. Teams that outgrow its capabilities will likely need a more comprehensive tool alongside it.
ELK Stack
The ELK Stack, which stands for Elasticsearch, Logstash, and Kibana, is one of the most widely used open-source observability foundations around. A large portion of engineering teams have it running somewhere in their infrastructure, often as the backbone of their log management setup. Elastic has since expanded the platform into a broader observability offering covering logs, metrics, and traces.
Its AI capabilities come through Elastic's machine learning features, which handle anomaly detection and pattern recognition across log and metric data. More recently, Elastic added an AI assistant that lets teams query their observability data in natural language and get contextual answers during incident investigation.
Best for: Teams already running the ELK Stack who want to build on their existing investment, or those that need a highly customizable open-source foundation they can shape to fit their specific infrastructure.
Worth knowing: The ELK Stack's flexibility comes with real engineering overhead. Setting it up well, keeping it performant at scale, and maintaining it over time is a significant commitment. Its AI capabilities are also more reactive than truly agentic compared to purpose-built platforms like Dynatrace. Teams without dedicated infrastructure engineering capacity should weigh that cost carefully before going down this path.
How to Choose the Best Agentic AI Observability Tool for Your Team
There is no single best agentic AI observability tool. The right choice comes down to what you are building and where your gaps are.
A few questions worth asking:
- What are you actually trying to observe? LLM output quality points you toward Galileo, Braintrust, or LangSmith. Full-stack infrastructure coverage points to Datadog or Dynatrace. Mobile visibility gaps point to Luciq, because none of the general-purpose tools on this list will close them adequately.
- How much setup are you willing to invest? Grafana and the ELK Stack offer flexibility but require real engineering commitment. Managed platforms like Datadog and Honeycomb get you to useful insights faster.
- Do you need truly agentic behavior or just smarter alerting? There is a meaningful difference between a tool that helps engineers investigate faster and one that autonomously correlates signals and surfaces root causes unprompted.
Most teams running complex AI products end up using more than one tool, typically a full-stack platform for backend coverage, a specialized LLM tool for the AI layer, and a dedicated solution for mobile. Each layer has distinct enough requirements that no single agentic AI observability tool covers all of them well.
See What Purpose-Built Agentic Mobile Observability Can Do
Most agentic AI observability tools on this list were built for backend and AI pipeline use cases. Mobile was never their primary focus, and it shows. Device fragmentation, unpredictable network conditions, and the sheer variability of real-world mobile environments create a class of observability challenges that general-purpose platforms are not equipped to handle.
Luciq was built specifically for this. It ingests signals across crashes, performance metrics, network events, and user sessions, autonomously correlates them, and surfaces root causes without requiring engineers to manually piece the story together.
Request a demo and experience what agentic mobile observability can do for your team.