


TL;DR: The Luciq AI Debugging Assistant is an agentic capability inside the Resolve Agent that takes mobile app debugging from manual detective work to autonomous resolution. Instead of handing developers a stack trace and wishing them luck, the AI Debugging Assistant analyzes telemetry across the full app footprint, identifies the root cause in plain English, reconstructs the exact reproduction steps, and surfaces the pattern driving the crash. Luciq is the first and leading Agentic Mobile Observability platform, and the AI Debugging Assistant is what modern mobile crash debugging looks like when the tooling stops informing and starts resolving.
A developer at a scaled mobile team gets paged at 2:47 PM on a Wednesday. The alert is a konan::abort() on iOS, 47 occurrences in the last hour, spread across six device models. They pull up the stack trace. It says nothing useful. They open the session replay in another tab, cross-reference the network logs in a third, scroll through user interaction timelines looking for the event sequence that triggered the failure, and eventually realize the crash only fires when a specific feature flag is enabled on iOS 26 during a discount code toggle. The fix takes eleven minutes. Finding the fix took three hours.
This is the part of mobile app debugging nobody benchmarks on the sprint board. It's not in your MTTR dashboard. It's not in your on-call rotation metrics. It's the invisible tax your senior engineers pay every time a production crash lands, and it is the specific problem the Luciq AI Debugging Assistant was built to solve.
Why Mobile App Debugging Still Breaks at the Stack Trace
Mobile app debugging has always had a tooling problem. Crash reporters surface the event. Observability dashboards surface the telemetry. IDEs surface the code. None of them tell the developer why the crash happened, which is the only question worth answering.
The Stack Trace Is Where Debugging Stops, Not Where It Starts
Opaque errors like konan::abort() or Application Not Responding events give developers nothing to act on. The stack trace points at a symptom, not a cause. And the cause usually lives somewhere the stack trace cannot see: in a specific SDK version, a backend latency spike, a memory leak on one device family, a feature flag interaction nobody flagged for mobile.
Traditional mobile crash debugging treats this as a pattern-matching exercise. The developer stares at hundreds of crash reports and tries to spot the common thread in their head. That is what "triage" means at most companies. It is also what consumes most of the time.
The Reproduction Loop Is Where Time Goes to Die
Most mobile bugs are environmental. They depend on device, OS, network state, and user behavior in ways your test environment cannot replicate. The "cannot reproduce" loop that haunts sprint cycles is not a testing problem. It is a context problem. The developer needs to see the exact path that led to the crash, and traditional debugging tools make them reconstruct it manually.
AI Coding Assistants Cannot Close This Gap Alone
AI-assisted development is already inside the IDE. Cursor, Claude, Copilot, and similar tools generate code faster than ever. But generating code is not the bottleneck anymore. Understanding what that code is doing in production is. Without live production context piped into the agent, AI coding assistants are working with incomplete information. That is the gap the Luciq AI Debugging Assistant closes.
What the Luciq AI Debugging Assistant Actually Does
Luciq is the first and leading Agentic Mobile Observability platform, and the AI Debugging Assistant is a native layer of the Luciq SDK. It lives inside the Resolve Agent workflow and takes the three hardest parts of mobile crash debugging off the developer's plate.
Three Pillars of Agentic Debugging
The AI Debugging Assistant consolidates what used to be four separate investigations into a single agentic workflow: root cause analysis, automated reproduction, and pattern recognition. Each one removes a specific manual step that traditional mobile app debugging forces engineers to do themselves.
Pillar 1 | Root Cause Analysis That Goes Beyond the Stack Trace
When a crash lands, the AI Debugging Assistant analyzes telemetry across the entire app footprint and returns three things the developer can act on immediately.
The first is an executive summary: a plain-English explanation of what failed and why, written the way a senior engineer would explain it to a junior. No stack trace archaeology. No "here's your data, good luck." Just the answer.
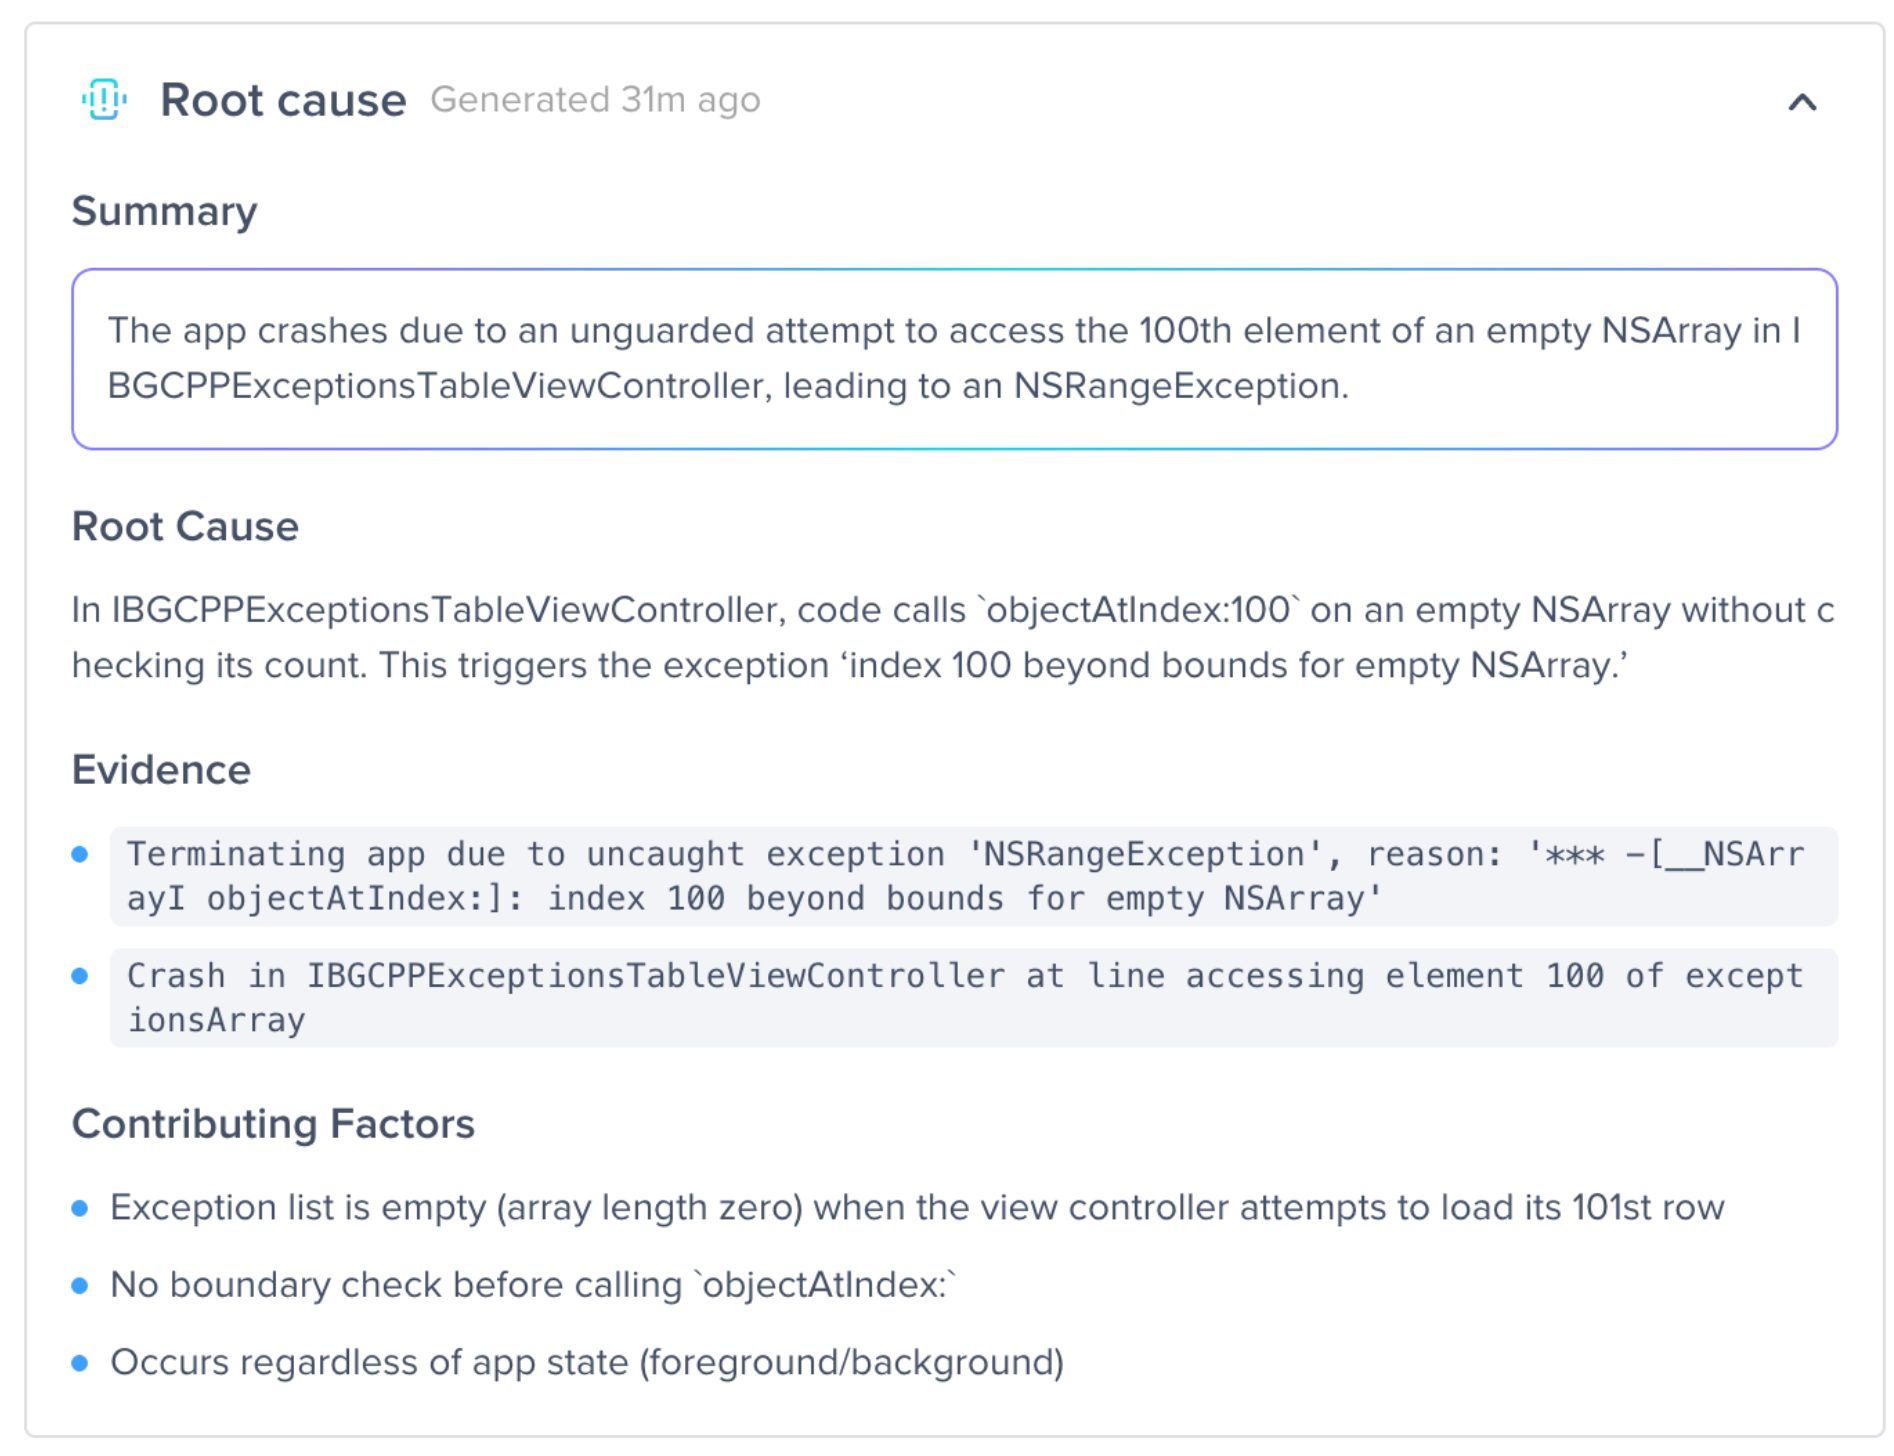
The second is evidence-based context. The Assistant links the crash directly to the specific lines of code or network calls triggered at the moment of impact. The developer sees the failure point in the codebase, not buried in a log viewer three tabs away from their editor.
The third is contributing factors. The Assistant identifies whether the issue is tied to specific SDK versions, memory leaks, backend latency, or device-specific behavior. That context is what separates a 20-minute fix from a four-hour investigation.
Pillar 2 | Automated Reproduction Steps: Watch the Tape
The most time-consuming part of mobile crash debugging is proving the bug exists on the developer's own machine. The AI Debugging Assistant reconstructs the exact sequential actions that led to the crash.
User launched app on iPhone 17. Navigated to Checkout. Toggled Discount Code. App Crashed.
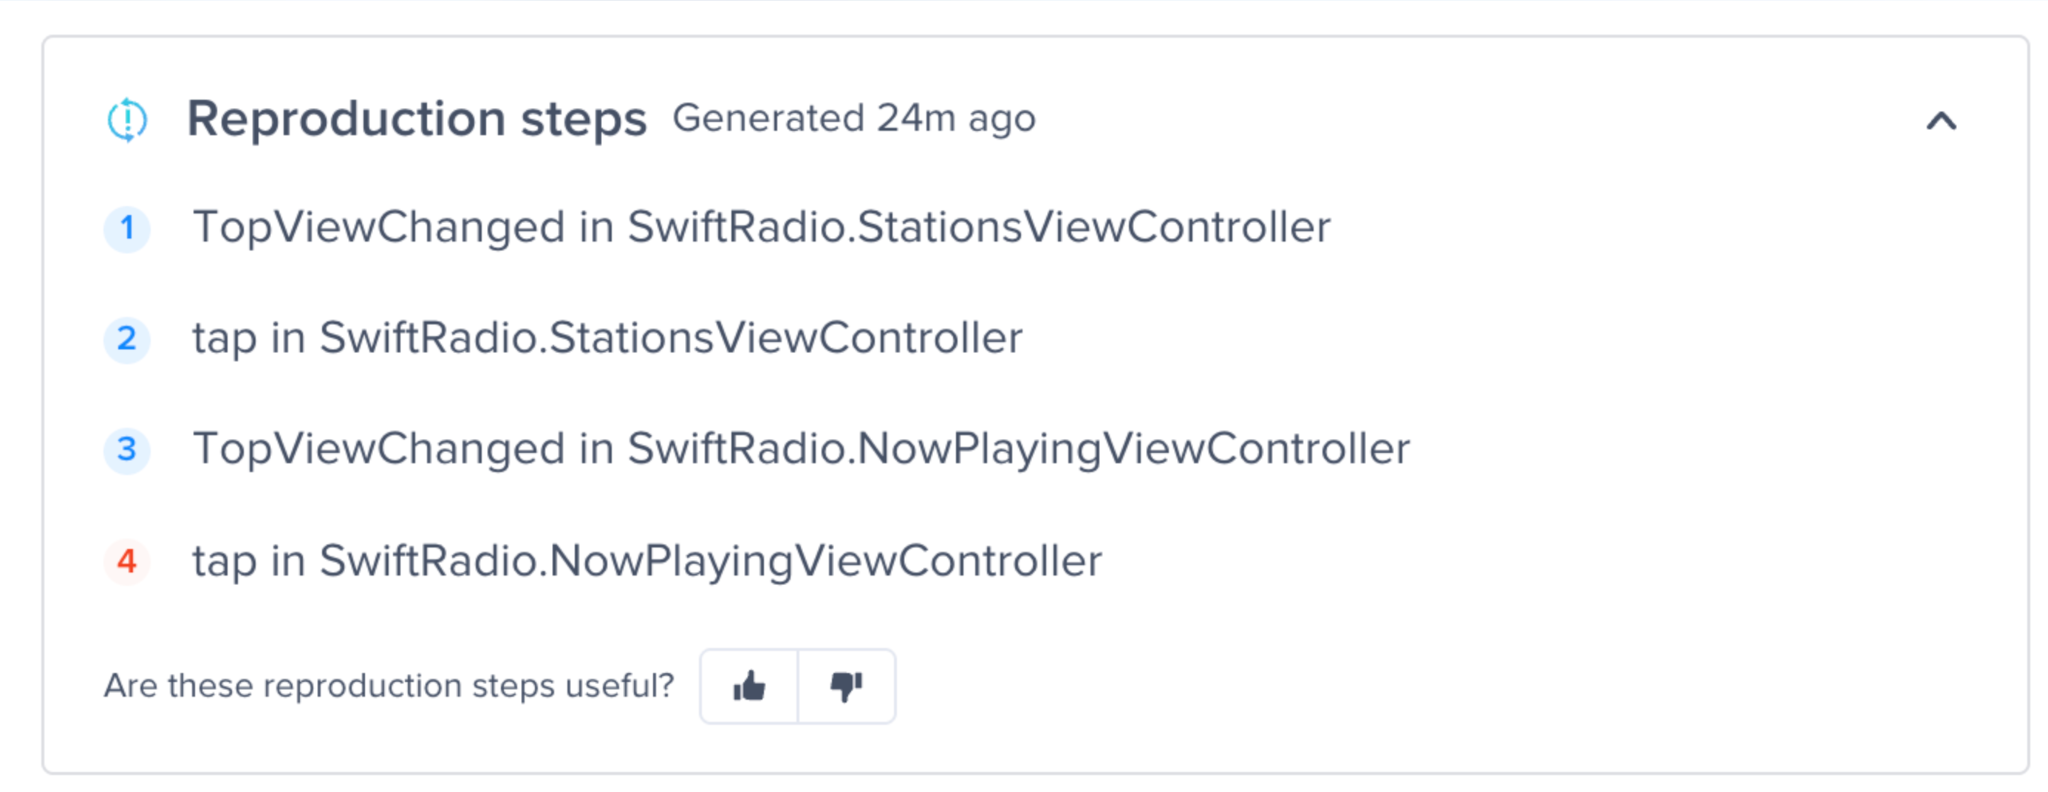
Four steps, clearly sequenced, directly traceable. The "cannot reproduce" loop that costs sprint cycles disappears because the reproduction is handed to the developer as a finished artifact. This is the capability QA teams have been waiting for since the first mobile app shipped.
Pillar 3 | Pattern Insights: Signal in the Noise
Is this a global catastrophe or a localized edge case? That question determines everything about how the fix gets prioritized and shipped, and traditional mobile app debugging tools force the developer to answer it manually.
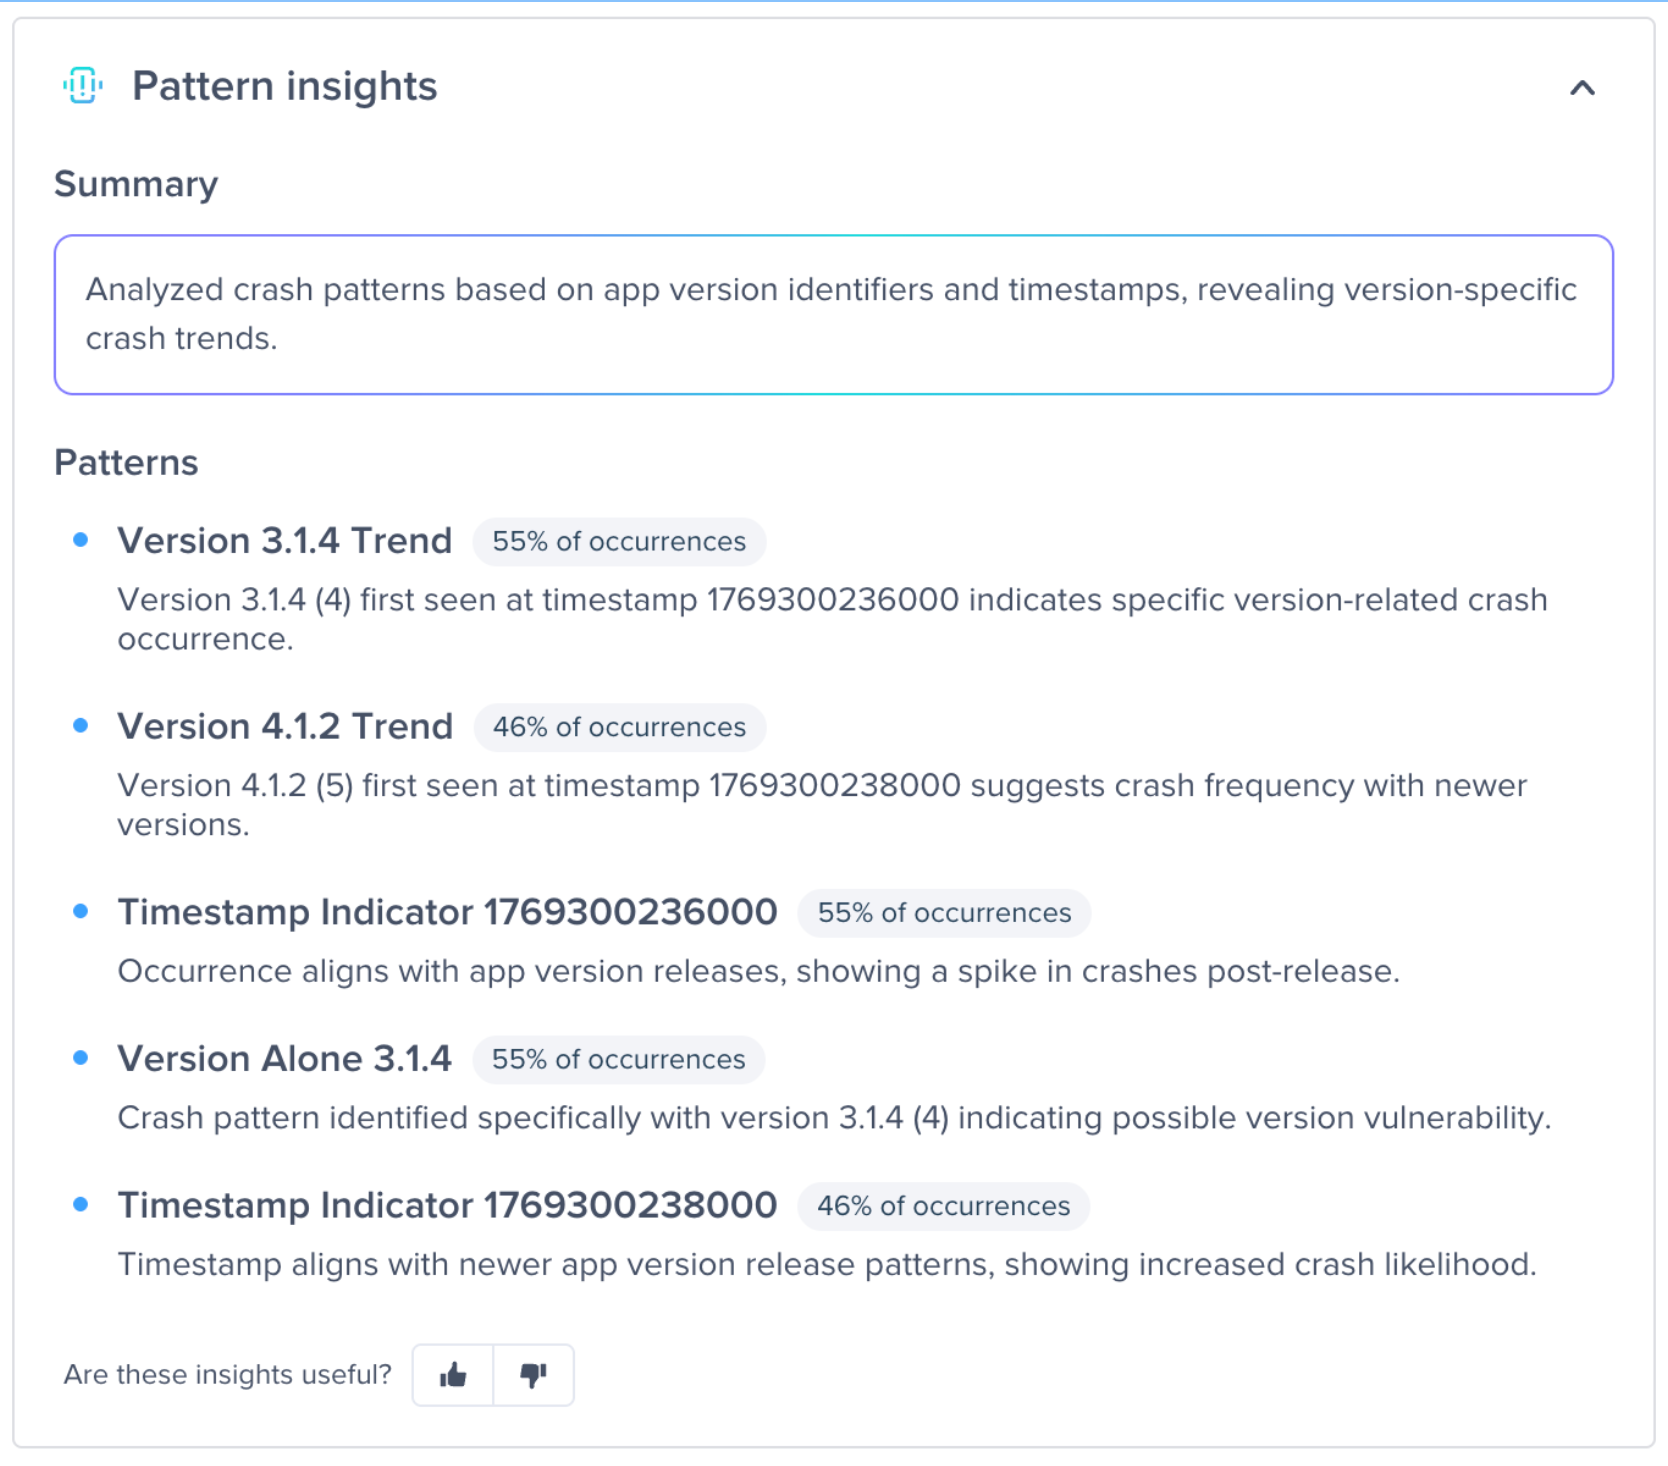
Pattern Insights correlates data points automatically. It identifies whether a crash only occurs on a specific device like an iPhone 17, whether it is tied to a feature flag like Login V2, or whether it is a multi-factor correlation. A real example surfaced in the Assistant: 90% of occurrences happening when the Login V2 feature flag is enabled on iOS 26. That is the kind of insight a senior engineer might reach after a day of investigation. The Assistant surfaces it in seconds.
Choose Your Own Flow: AI Debugging Built for How Developers Actually Think
Every developer has a different mental model for solving problems. Luciq designed the AI Debugging Assistant as a choose your own flow experience rather than a rigid script.
The recommended sequence is Root Cause to Reproduction to Patterns. But if the developer suspects a faulty feature flag rollout, they can jump straight to Pattern Insights.
If they are a visual learner, they can start with the reproduction steps and work backward. All three capabilities live inside the Resolve Agent, which means the developer never has to context-switch between tools to get the full picture.
This is what AI debugging looks like when the product respects the developer's intuition instead of forcing them through a fixed workflow.
Why Luciq: The Context Advantage That Makes AI Debugging Work
Most mobile app debugging tools act like a witness who arrived five minutes after the accident. They can show you the wreckage (the stack trace), but they did not see the lead-up. The Luciq AI Debugging Assistant is different because Luciq is the only platform that bridges the context gap.
High-Fidelity Data vs. Fragmented Snapshots
Other debugging tools require the developer to context-switch, jumping from a crash reporter to a separate logging tool to a network monitor and finally to the IDE. Every jump loses fidelity. Because the AI Debugging Assistant is a native layer of the Luciq SDK, the context is already there. It automatically synthesizes stack traces, 5G and WiFi radio states, and tap-and-scroll sequences into a single deterministic narrative.
This matters because AI debugging is only as good as the data it operates on. Generic AI tools trained on public codebases cannot know what your app did at 2:47 PM on device 4 of 14 affected. Luciq's agentic AI can, because the data was already captured.
Built for the Developer's Mental Model
Generic AI tools often provide the answer while simply forcing the developer to trust its conclusion. The Luciq AI Debugging Assistant honors the way developers actually think. The Root Cause to Reproduction to Pattern Insights flow maps to how senior engineers diagnose production issues, and the flexibility to jump between stages means the tool adapts to the developer's intuition rather than the other way around.
How Luciq Compares to Legacy Mobile Debugging Tools
A direct side-by-side of what changes when agentic mobile app debugging replaces traditional tooling.
AI Debugging: The Road to Autonomous Resolution
The Luciq AI Debugging Assistant is not the end state. It is a bridge to the future of autonomous mobile observability, which is why it matters beyond the immediate productivity gain.
Not a Smarter Dashboard, an Actual Teammate
Most observability platforms have added AI features the same way they add filters: as one more thing the developer can turn on. The AI Debugging Assistant is built differently. By providing deep context in a structured format, Luciq is preparing the foundation for Coding Agent Integration. The same insights the Assistant generates will pipe directly into coding agents like Claude and Cursor, which means the IDE will suggest and apply fixes based on real-world telemetry, not public training data.
This is what closes the loop. Production context flows into the AI coding assistant. The AI coding assistant generates fixes informed by what actually happens. The developer stays in flow. The crash-to-merged-PR cycle compresses from hours to minutes.
Why This Is the Only Agentic Mobile Debugging Workflow That Ships
Every mobile team has tried to bolt AI onto debugging before. It rarely sticks because the AI does not have enough context to generate answers worth trusting. Luciq is the first and leading Agentic Mobile Observability platform specifically because the SDK captures the right context at the right fidelity to make agentic debugging viable, not theoretical.
Watch the AI Debugging Assistant in action: a quick walkthrough of how the Assistant handles a live crash, start to finish.
Your next production crash is already in the queue - request a demo and see Luciq resolve it before your engineers even open a second tab.