


TL;DR: Mobile app performance metrics go beyond crash-free rate and load time. Network observability, the practice of tracking API failure rates, latency patterns, and timeout frequency across real devices and carriers, surfaces the performance degradation that standard mobile app performance metrics miss entirely. Luciq, the first and leading Agentic Mobile Observability platform, links every network failure directly to session replays and user journeys, so engineering teams can isolate bottlenecks, understand real-world impact, and resolve issues before they drive churn. This is what modern mobile app performance metrics look like when they actually connect to revenue.
Your checkout API times out on a specific carrier network, on a specific Android build, for roughly 3% of your users during peak hours. No crash fires. No error message surfaces. No alert triggers because the call does not fail often enough to cross the threshold. The affected users wait, nothing happens, and they leave.
Three months later, that 3% shows up in your churn data. Six months later, it shows up in your app store reviews as "the app stops working sometimes." Nobody on your engineering team ever saw the signal directly, because the mobile app performance metrics you use to watch performance were never built to catch it.
The Mobile App Performance Metric Most Teams Are Missing
Crash-free rate gets tracked. App launch time gets tracked. But the API call that times out on a specific carrier network, on a specific device, for a specific segment of your highest-value users? That one disappears into the noise until it shows up in your churn data or your app store reviews. Network performance is the mobile app performance metric category most teams under-instrument and most users feel the hardest.
Silent Failures Are the Expensive Mobile App Performance Metrics
Network degradation and latency are the silent performance killers in mobile. They do not produce a crash. They do not always produce a visible error state. They produce a user who waited, got nothing, and quietly left. That user does not file a bug report. They do not leave a review. They uninstall and move on, and by the time your analytics team notices the pattern, you have lost them for good. The mobile app performance metrics that catch this kind of failure are not in most standard APM dashboards.
Your Dashboard and Your Users Do Not See the Same App
For engineering leaders tracking mobile app performance metrics, the gap between what the dashboard shows and what users actually experience is almost always a network observability gap. Your monitoring is reporting on what it can measure. Your users are experiencing everything else. The mobile app performance metrics that close that gap sit in the network layer.
Watch Network Observability Close the Mobile App Performance Metrics Gap
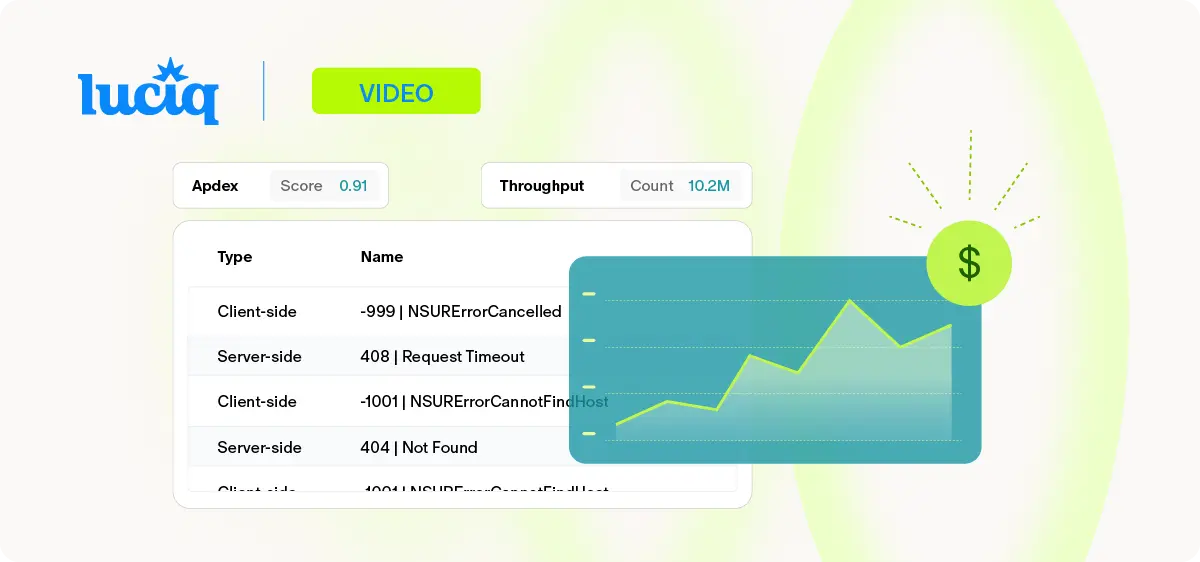
The video below is a technical walkthrough of Luciq's network observability workflow, from the performance dashboard through failure categorization, granular span analysis, and full session replay linked directly to the network event that caused it. This is what modern mobile app performance metrics look like when they are actually connected to the user experience.
What You're Seeing in the Video
The network performance dashboard (0:00–0:42). Every API call within a session is captured and surfaced in a single view, sortable by failure rate or by ABIC score, a composite metric that balances failure rates with latency on successful calls. This is the view that tells you which endpoints are actually hurting your users, which is the only mobile app performance metrics cut that matters for prioritization.
Client-side vs. server-side categorization (0:43–1:16). Failures are automatically sorted into client-side and server-side errors, which means the right team gets the right signal without a triage meeting. A network timeout caused by the device's connectivity state is a different problem than a 500 returned from your backend. Treating them as the same mobile app performance metric is how teams end up investigating issues they were never going to fix.
Granular span analysis (1:17–1:44). This section is worth your attention. A specific API failure gets isolated, linked to backend monitoring for server-side investigation, and then connected to a full session replay so you see not just what failed technically, but what the user experienced at the exact moment it failed. That connection between the technical signal and the human impact is what makes mobile app performance metrics actionable rather than academic.
Session replay linkage (1:45–2:10). The network event and the user's screen are visible in the same view. Engineers see the failure in context: the tap that triggered it, the spinner that appeared, the moment the user gave up. This is the difference between mobile app performance metrics that inform and mobile app performance metrics that drive decisions.
What Network Observability Adds to Your Mobile App Performance Metrics Stack
Network observability for mobile means capturing every API call within a session, sorted by failure rate, latency, and business impact, and making those mobile app performance metrics actionable without manual log diving.
The Workflow Starts With a Ranked View, Not a Raw Feed
The network performance dashboard shows all API calls within a session and is sortable by failure rate or an ABIC score that weighs failure rates against latency for successful calls. Failures are automatically categorized into client-side and server-side errors, so the right team gets the right signal immediately without a triage meeting. These mobile app performance metrics are organized for decisions, not for inspection.
Slow-but-Successful Requests Get Their Own Lens
For successful requests that still feel slow, granular span data breaks the request lifecycle into specific operations: DNS lookup, connection establishment, server processing time. The bottleneck is identifiable without hours of manual investigation, which is the difference between knowing your app is slow and knowing why. This is where real user monitoring (RUM) and network observability converge into actionable mobile app performance metrics.
API Latency Is a Revenue-Linked Mobile App Performance Metric
Luciq's 2026 Mobile App Performance Playbook show a 0.1% reliability lift prevents tens of thousands of failed sessions per month, protecting ratings, retention, and millions in revenue. That is not a second-order effect. That is a mobile app performance metric tied directly to the revenue line. Network observability is how you see those milliseconds before they show up in your finance dashboard.
Session Abandonment Looks Like User Drop-Off in Your Funnel
A checkout flow that hangs on a slow or failed API call does not produce a crash report. It produces a lost conversion that shows up in your funnel analytics as user drop-off at the payment step. Most teams attribute that drop-off to UX, pricing, or intent. A meaningful slice of it is actually network latency and degradation that nobody on the engineering side can see, because their mobile app performance metrics stack does not include network observability.
Peak-Event Churn Has a Specific Cause
Luciq's No Margin for Error report found that 53.2% of users abandoned purchases during major sales events due to performance failures. Network timeouts under peak load are a leading cause. The traffic surge that makes an event commercially meaningful is the same surge that exposes every latent infrastructure weakness, and users during peak events have the least patience of any cohort you will ever serve.
Load Time Is Still One of the Most Punishing Mobile App Performance Metrics
Luciq's No Margin for Error report found that nearly one-third of Gen Z users will switch to a competitor within five seconds of a delay, and 81.3% of all users rate performance as "Very" or "Extremely important" when deciding whether to use an app. For mobile apps, load-time performance metrics and network observability frequently describe the same user experience from different angles. Network latency is often a primary contributor to perceived delay, making the two complementary instruments, not redundant ones.
App Store Ratings Reflect Network Quality
Slow performance is cited as a deal-breaker by 21.2% of users who leave negative reviews, second only to crashes, according to Luciq's No Margin for Error report. Much of that slow performance has a network component. Which means your network observability is not a backend engineering tool. It is an app store rating lever, and the mobile app performance metrics that capture it belong in every engineering leader's weekly review. For engineering leaders, network observability is not a developer tool. It is a revenue protection instrument built on the mobile app performance metrics that actually move retention.
Read Next → Mobile Application Performance Monitoring for Mobile Teams


